Technical Analysis of VIOG 2024-05-10
Overview:
In analyzing the technical indicators for VIOG over the last 5 days, we will delve into the trend, momentum, volatility, and volume indicators to provide a comprehensive outlook on the possible stock price movement in the coming days.
Trend Indicators:
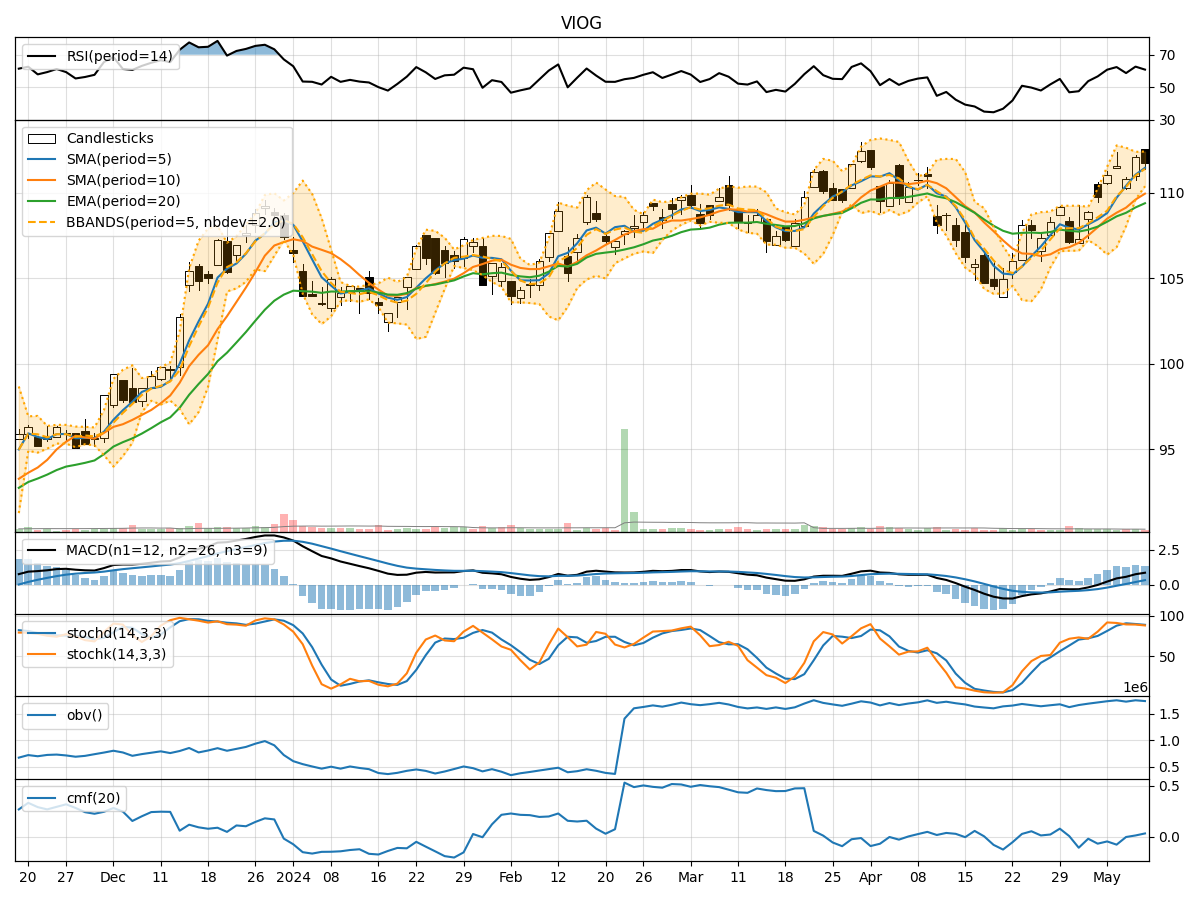
- Moving Averages (MA): The 5-day Moving Average has been consistently above the Simple Moving Average (SMA) and Exponential Moving Average (EMA), indicating a bullish trend.
- MACD: The MACD line has been above the signal line for the past 5 days, with the MACD Histogram showing an increasing trend, suggesting bullish momentum.
Momentum Indicators:
- RSI: The Relative Strength Index (RSI) has been fluctuating around the 60-62 range, indicating a neutral momentum.
- Stochastic Oscillator: Both %K and %D have been gradually decreasing, signaling a potential bearish momentum shift.
- Williams %R: The Williams %R has been hovering in the oversold territory, suggesting a possible reversal to the upside.
Volatility Indicators:
- Bollinger Bands: The stock price has been trading within the Bollinger Bands, with the bands narrowing, indicating decreasing volatility.
Volume Indicators:
- On-Balance Volume (OBV): The OBV has been relatively stable, showing no significant divergence from price movements.
- Chaikin Money Flow (CMF): The CMF has been slightly negative, indicating some selling pressure in the market.
Key Observations:
- The trend indicators suggest a bullish sentiment with moving averages and MACD supporting an upward trend.
- Momentum indicators show mixed signals with RSI neutral, Stochastic indicating a potential bearish reversal, and Williams %R signaling a possible buying opportunity.
- Volatility is decreasing based on Bollinger Bands, indicating a period of consolidation.
- Volume indicators do not show significant divergence, suggesting stability in trading activity.
Conclusion:
Based on the analysis of the technical indicators, the stock price of VIOG is likely to experience sideways consolidation in the coming days. While the trend remains bullish, the momentum indicators show conflicting signals, and volatility is decreasing, indicating a period of stability. Traders may consider holding positions or waiting for clearer signals before making significant trading decisions.