Technical Analysis of VIOV 2024-05-10
Overview:
In analyzing the technical indicators for VIOV over the last 5 days, we will delve into the trends, momentum, volatility, and volume indicators to provide a comprehensive outlook on the possible stock price movement. By examining these key aspects, we aim to offer valuable insights and predictions for the upcoming days.
Trend Analysis:
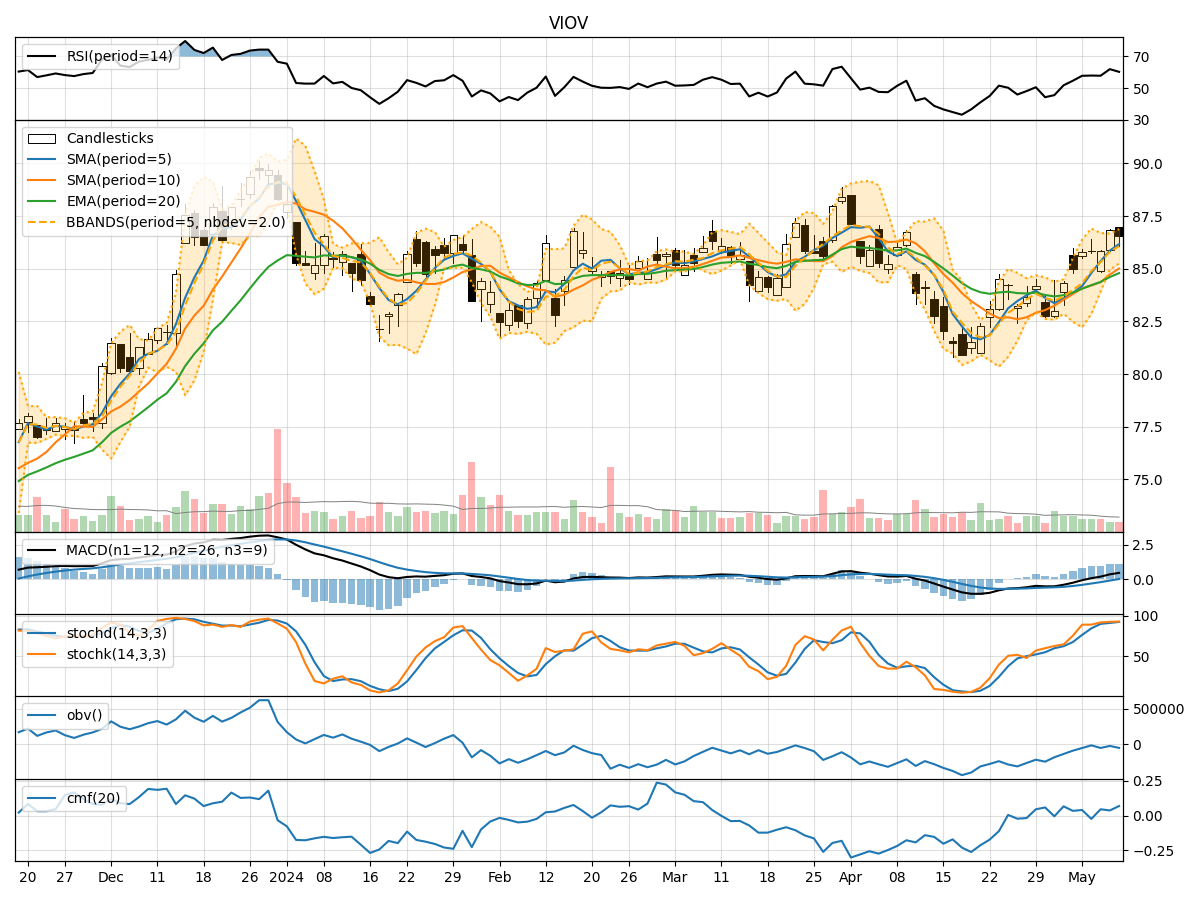
- Moving Averages (MA): The 5-day Moving Average (MA) has been consistently above the Simple Moving Average (SMA) and Exponential Moving Average (EMA), indicating a bullish trend.
- MACD: The MACD line has been consistently above the signal line, with the MACD histogram showing positive values, suggesting a bullish momentum.
Momentum Analysis:
- RSI: The Relative Strength Index (RSI) has been fluctuating around the 60-70 range, indicating a neutral to slightly bullish momentum.
- Stochastic Oscillator: Both %K and %D have been in the overbought zone, suggesting a potential reversal or consolidation.
Volatility Analysis:
- Bollinger Bands: The stock price has been trading within the Bollinger Bands, with the bands widening slightly, indicating increased volatility.
Volume Analysis:
- On-Balance Volume (OBV): The OBV has shown mixed movements, reflecting indecision among market participants.
- Chaikin Money Flow (CMF): The CMF has been positive, indicating buying pressure in the market.
Key Observations:
- The trend indicators suggest a strong bullish sentiment in the short term.
- Momentum indicators show a mixed picture with a slight bullish bias.
- Volatility has increased slightly, potentially leading to larger price swings.
- Volume indicators reflect a neutral stance with some buying pressure.
Conclusion:
Based on the analysis of the technical indicators, the next few days' possible stock price movement for VIOV is likely to continue in an upward direction. The bullish trend supported by moving averages and MACD, coupled with a neutral to slightly bullish momentum, indicates potential for further price appreciation. However, caution is advised as the stochastic oscillator signals overbought conditions, and increased volatility could lead to sharp price movements. Traders should closely monitor price action and key support/resistance levels for timely decision-making.
Recommendation:
Considering the overall bullish outlook, traders may look for buying opportunities on pullbacks or breakouts, while implementing risk management strategies to protect against sudden reversals. It is essential to stay informed about market developments and adjust trading strategies accordingly to capitalize on potential price movements.