Technical Analysis of VLU 2024-05-10
Overview:
In analyzing the technical indicators for VLU stock over the last 5 days, we will delve into the trend, momentum, volatility, and volume indicators to provide a comprehensive outlook on the possible stock price movement in the coming days. By examining these key indicators, we aim to offer valuable insights and predictions for potential investors.
Trend Analysis:
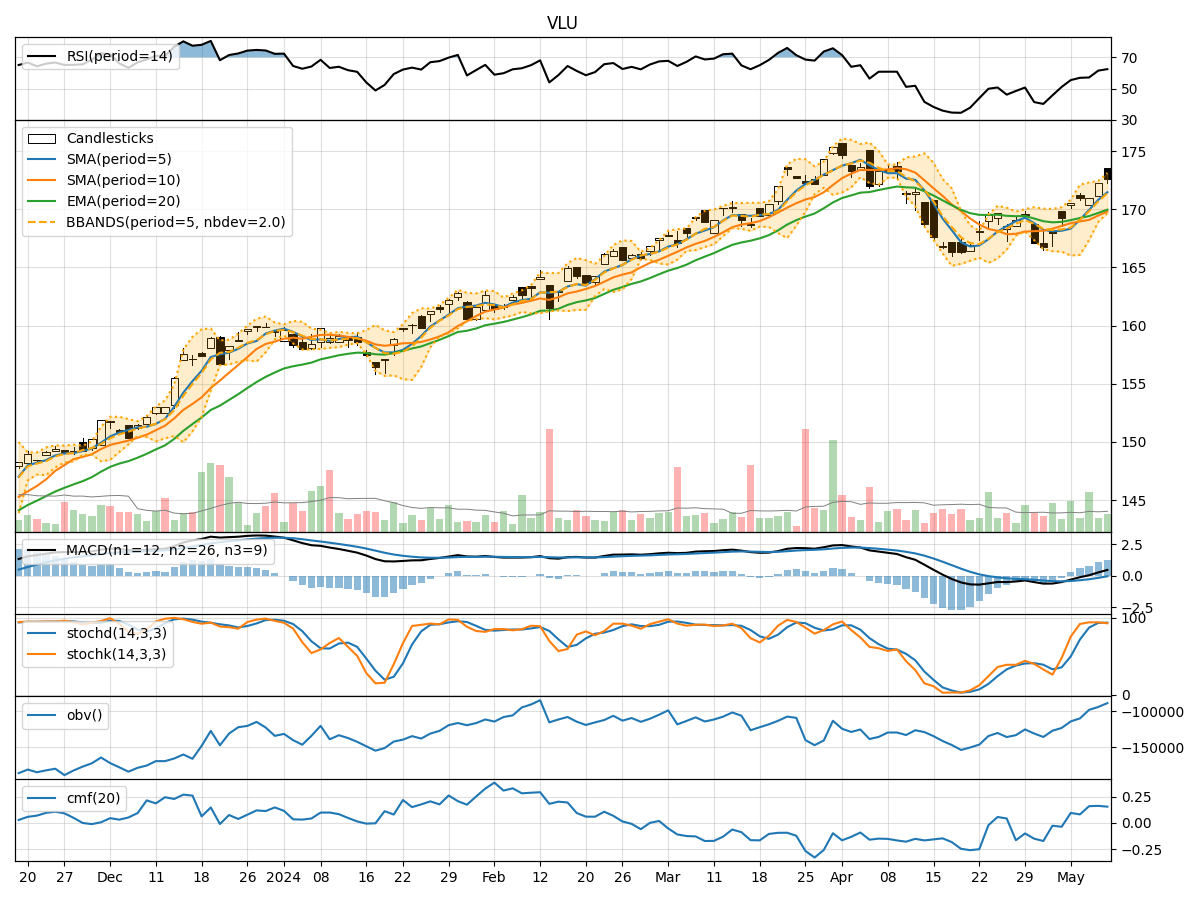
- Moving Averages (MA): The 5-day Moving Average (MA) has been consistently rising, indicating a bullish trend in the short term.
- MACD: The MACD line has been above the signal line for the past 5 days, suggesting a bullish momentum.
- EMA: The Exponential Moving Average (EMA) has also been trending upwards, supporting the bullish sentiment.
Momentum Analysis:
- RSI: The Relative Strength Index (RSI) has been increasing, showing strengthening momentum.
- Stochastic Oscillator: Both %K and %D have been in the overbought zone, indicating a strong bullish momentum.
- Williams %R: The Williams %R has been fluctuating but generally in the oversold territory, suggesting a potential reversal.
Volatility Analysis:
- Bollinger Bands: The stock price has been trading within the upper Bollinger Band, indicating high volatility and a potential overbought condition.
- Bollinger Band Width: The Band Width has been narrowing, suggesting a possible decrease in volatility.
Volume Analysis:
- On-Balance Volume (OBV): The OBV has been mostly positive, indicating accumulation by investors.
- Chaikin Money Flow (CMF): The CMF has been positive, suggesting buying pressure in the stock.
Key Observations:
- The trend indicators show a strong bullish sentiment with rising moving averages and positive MACD.
- Momentum indicators indicate a robust bullish momentum with overbought conditions in the stochastic oscillator.
- Volatility has been high, as seen in the upper Bollinger Band, but the narrowing Band Width may signal a potential decrease in volatility.
- Volume indicators suggest accumulation and buying pressure in the stock.
Conclusion:
Based on the analysis of the technical indicators, the stock is likely to continue its upward trajectory in the coming days. The bullish trend, strong momentum, positive volume flow, and high volatility all point towards further price appreciation. Investors may consider buying or holding positions in VLU stock for potential gains. It is important to monitor the indicators closely for any signs of reversal or consolidation, but the current outlook remains bullish.