Technical Analysis of VMBS 2024-05-10
Overview:
In analyzing the technical indicators for VMBS over the last 5 days, we will delve into the trend, momentum, volatility, and volume indicators to provide a comprehensive outlook on the possible stock price movement. By examining these key factors, we aim to offer valuable insights and predictions for the upcoming trading days.
Trend Indicators:
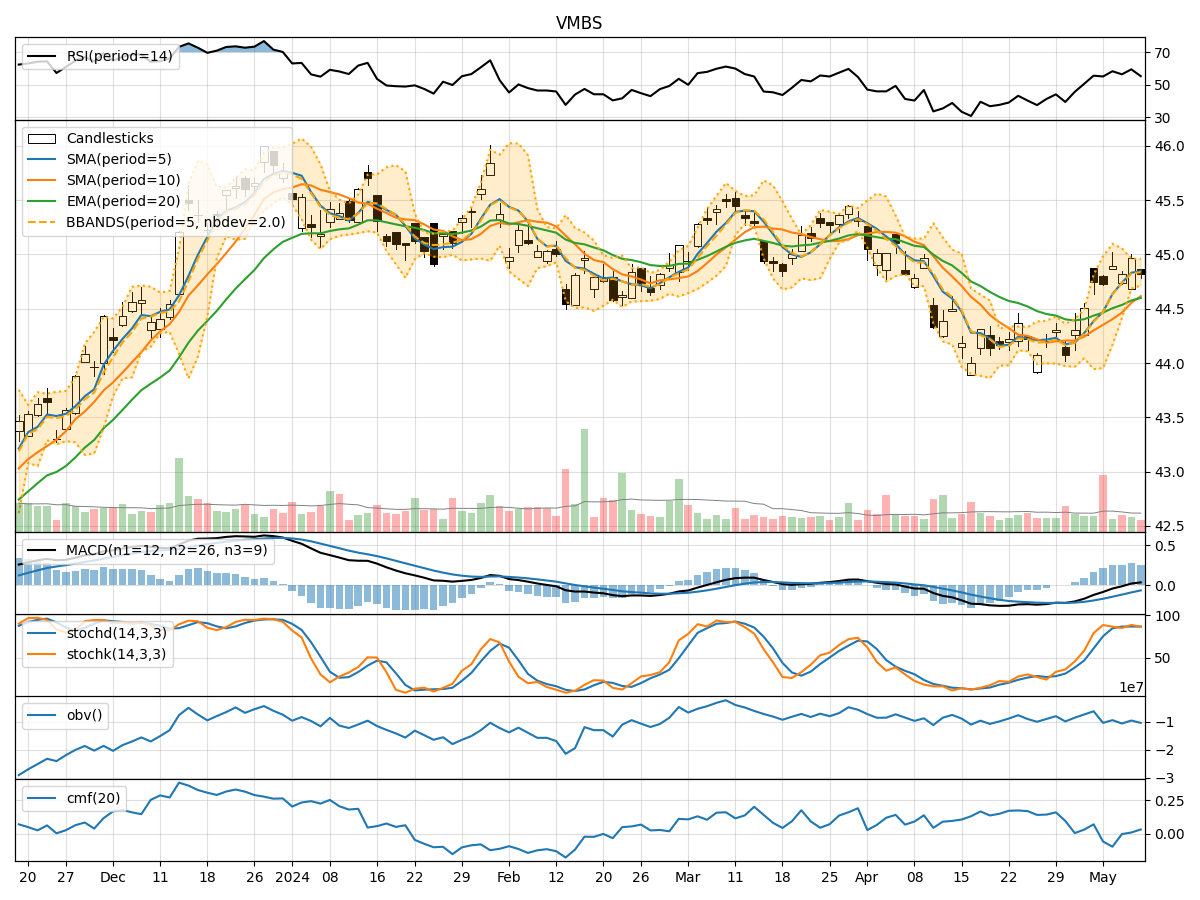
- Moving Averages (MA): The 5-day Moving Average (MA) has been consistently above the Simple Moving Average (SMA) and Exponential Moving Average (EMA), indicating a bullish trend.
- MACD: The MACD line has been positive, showing bullish momentum, and the MACD Histogram has been increasing, suggesting strengthening bullish momentum.
Momentum Indicators:
- RSI: The Relative Strength Index (RSI) has been fluctuating around the neutral zone, indicating indecision in the market.
- Stochastic Oscillator: Both %K and %D have been in the overbought region, signaling a potential reversal or consolidation.
- Williams %R: The Williams %R has been in the oversold region, suggesting a possible buying opportunity.
Volatility Indicators:
- Bollinger Bands (BB): The stock price has been trading within the Bollinger Bands, indicating normal volatility.
- Bollinger Band %B: The %B indicator has been fluctuating within the bands, reflecting price movements within the expected range.
Volume Indicators:
- On-Balance Volume (OBV): The OBV has shown mixed signals, with no clear trend in volume accumulation or distribution.
- Chaikin Money Flow (CMF): The CMF has been mostly negative, indicating some selling pressure in the market.
Key Observations:
- The trend indicators suggest a bullish sentiment in the short term.
- Momentum indicators show mixed signals, with potential for a reversal or consolidation.
- Volatility remains within normal levels, indicating stable price movements.
- Volume indicators reflect uncertainty in market participation and potential selling pressure.
Conclusion:
Based on the analysis of the technical indicators, the next few days for VMBS could see sideways consolidation with a slight upward bias. Traders should exercise caution and closely monitor key support and resistance levels for potential entry or exit points. It is advisable to wait for clearer signals from momentum and volume indicators before making significant trading decisions.