Technical Analysis of VMOT 2024-05-10
Overview:
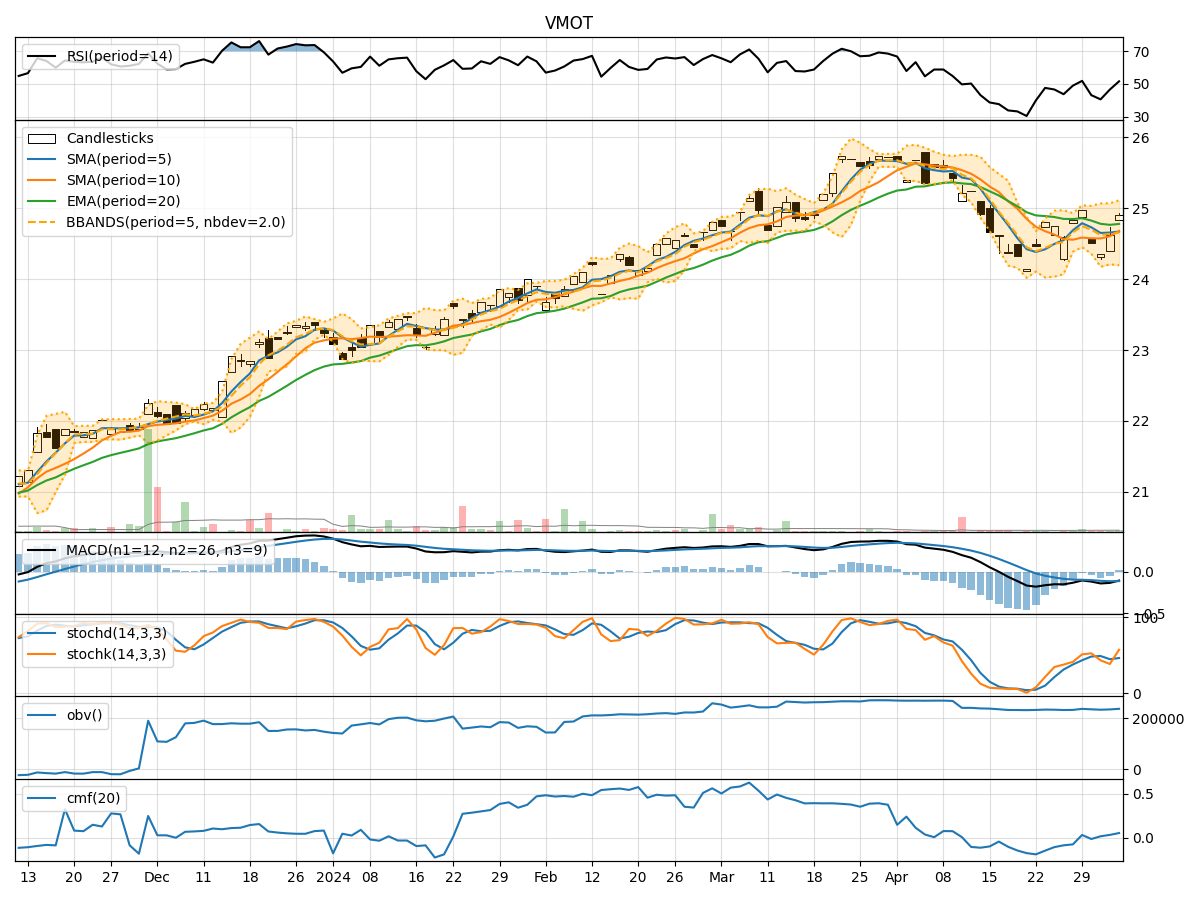
In the last 5 trading days, the stock has shown a mixed performance based on various technical indicators. The trend indicators suggest a slight uptrend, momentum indicators show a strengthening momentum, volatility indicators indicate decreasing volatility, and volume indicators demonstrate a steady increase in volume.
Trend Indicators:
- Moving Averages (MA): The 5-day moving average has been consistently above the longer-term moving averages (SMA and EMA), indicating a short-term uptrend.
- MACD: The MACD line has been consistently above the signal line, suggesting bullish momentum.
- MACD Histogram: The histogram has been showing a positive trend, indicating increasing bullish momentum.
Key Observation: The trend indicators collectively suggest an upward trend in the stock price.
Momentum Indicators:
- RSI: The RSI has been fluctuating around the overbought territory, indicating strong buying pressure.
- Stochastic Oscillator: Both %K and %D have been in the overbought zone, signaling a strong bullish momentum.
- Williams %R: The indicator has been hovering in the oversold region, suggesting a potential reversal to the upside.
Key Observation: Momentum indicators point towards a bullish sentiment in the stock.
Volatility Indicators:
- Bollinger Bands: The bands have been narrowing, indicating decreasing volatility in the stock price.
- Bollinger %B: The %B indicator has been fluctuating within a narrow range, suggesting a period of consolidation.
Key Observation: Volatility indicators signal a consolidation phase in the stock.
Volume Indicators:
- On-Balance Volume (OBV): The OBV has been steadily increasing, indicating accumulation by investors.
- Chaikin Money Flow (CMF): The CMF has been positive, reflecting buying pressure in the stock.
Key Observation: Volume indicators show positive accumulation and buying interest in the stock.
Conclusion:
Based on the analysis of the technical indicators, the stock is likely to experience further upward movement in the next few days. The trend indicators suggest an uptrend, momentum indicators indicate strong buying pressure, volatility indicators point towards consolidation, and volume indicators show positive accumulation. Therefore, the overall outlook for the stock is bullish in the short term. Investors may consider looking for buying opportunities or holding onto existing positions to benefit from the potential price appreciation.