Technical Analysis of VNAM 2024-05-10
Overview:
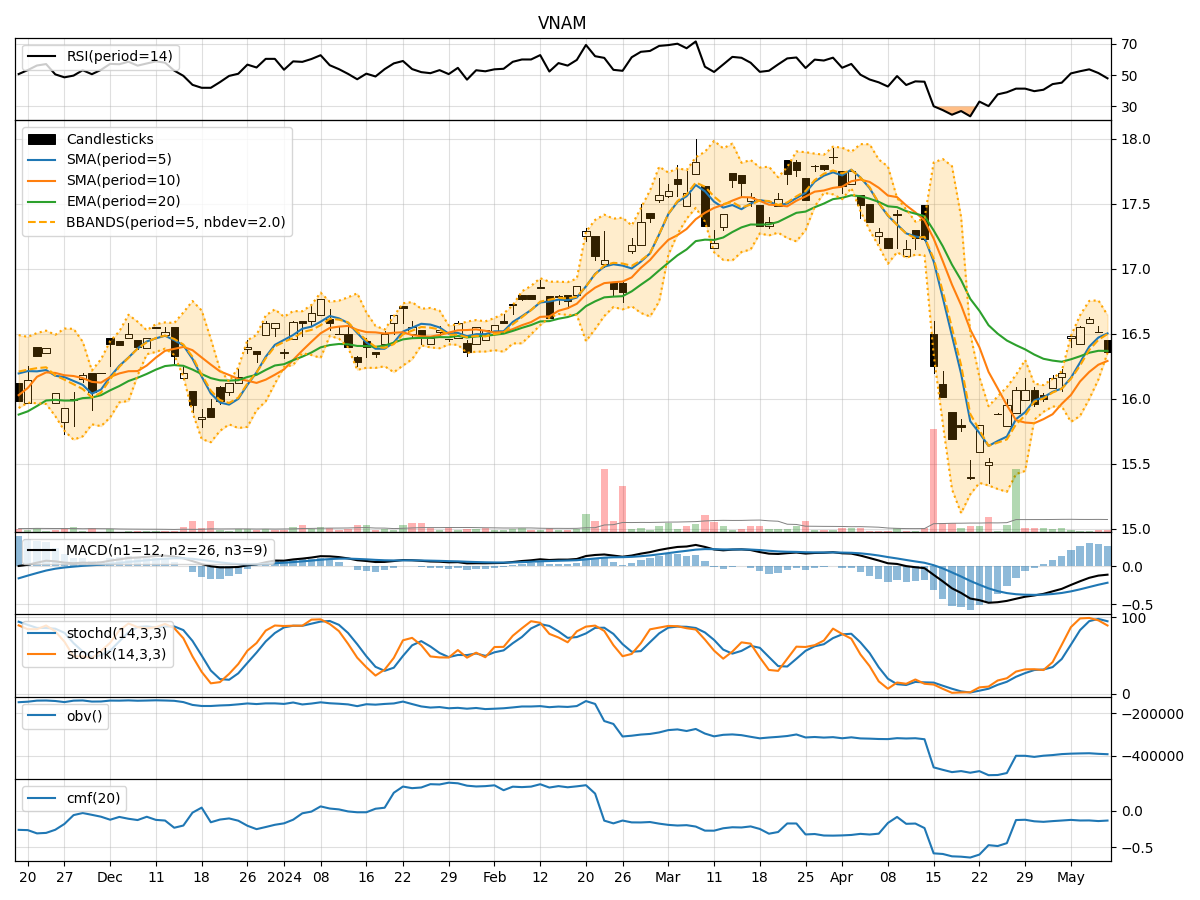
In analyzing the technical indicators for VNAM over the last 5 days, we will delve into the trend, momentum, volatility, and volume indicators to provide a comprehensive outlook on the possible stock price movement in the coming days. By examining key metrics such as moving averages, MACD, RSI, Bollinger Bands, and OBV, we aim to offer a detailed and insightful analysis to guide your investment decisions.
Trend Analysis:
- Moving Averages (MA): The 5-day MA has been consistently above the closing prices, indicating a short-term uptrend.
- MACD: The MACD line has been below the signal line but showing signs of convergence, suggesting a potential reversal.
- EMA: The EMA has been relatively stable, reflecting a gradual uptrend.
Key Observation: The trend indicators suggest a mild bullish sentiment in the short term.
Momentum Analysis:
- RSI: The RSI values have been fluctuating around the neutral zone, indicating a lack of strong momentum.
- Stochastic Oscillator: Both %K and %D have been declining, signaling a potential weakening of buying pressure.
- Williams %R: The indicator has been in oversold territory, suggesting a possible reversal.
Key Observation: Momentum indicators point towards a neutral to slightly bearish momentum.
Volatility Analysis:
- Bollinger Bands (BB): The bands have been narrowing, indicating decreasing volatility.
- Bollinger %B: The %B value has been hovering around the lower band, suggesting a potential oversold condition.
Key Observation: Volatility indicators signal a decrease in volatility and a possible consolidation phase.
Volume Analysis:
- On-Balance Volume (OBV): The OBV has been declining, indicating selling pressure.
- Chaikin Money Flow (CMF): The CMF has been negative, reflecting a lack of buying interest.
Key Observation: Volume indicators suggest a bearish sentiment with a lack of significant buying interest.
Conclusion:
Based on the analysis of the technical indicators, the next few days for VNAM stock price movement are likely to be sideways to slightly bearish. The trend indicators show a mild bullish sentiment, while momentum indicators point towards a neutral to slightly bearish momentum. Volatility indicators signal a decrease in volatility and a possible consolidation phase, while volume indicators suggest a bearish sentiment with a lack of significant buying interest.
Overall, the stock is expected to experience a period of consolidation with a slight bearish bias in the near term. Investors should exercise caution and closely monitor key support and resistance levels for potential entry or exit points.