Technical Analysis of VNQI 2024-05-10
Overview:
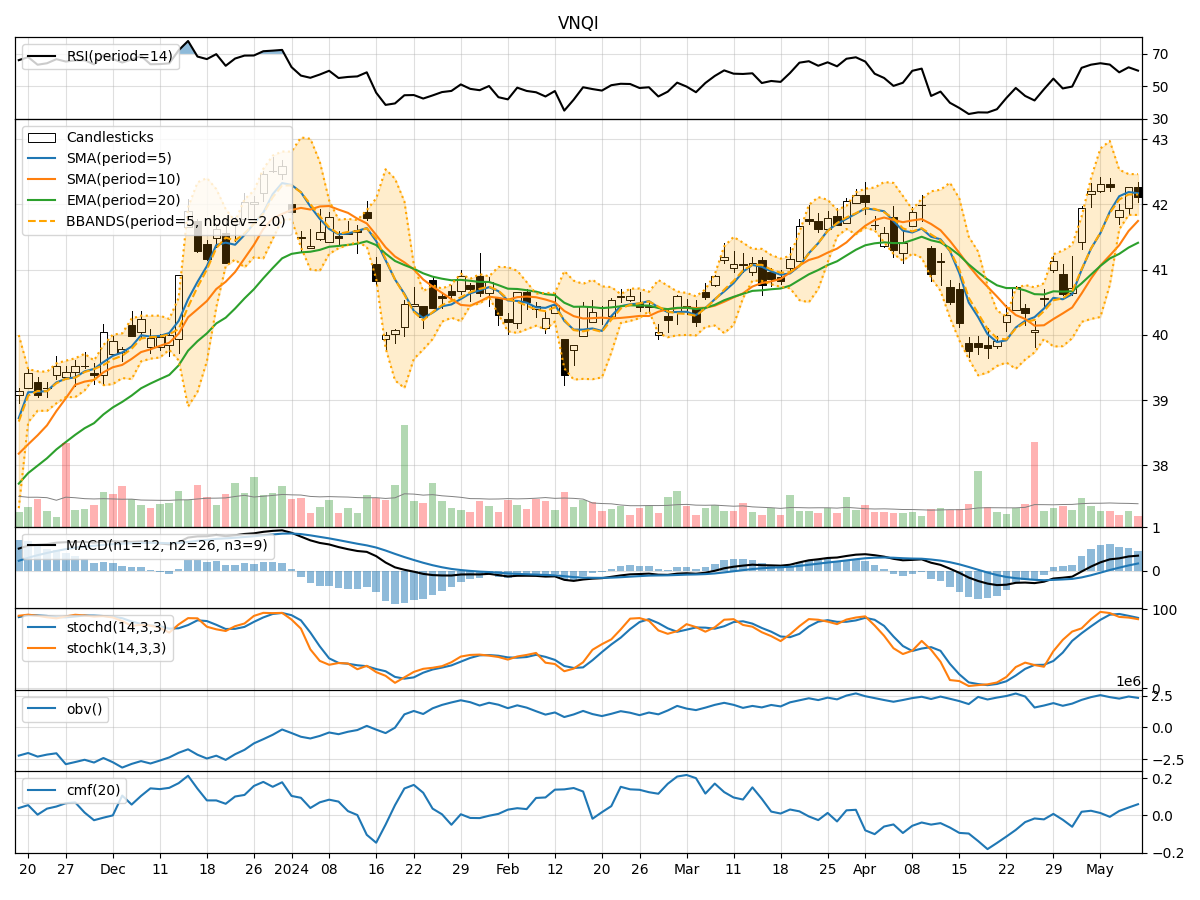
In analyzing the technical indicators for VNQI over the last 5 days, we will delve into the trend, momentum, volatility, and volume indicators to provide a comprehensive outlook on the possible stock price movement in the coming days. By examining these key indicators, we aim to offer valuable insights and predictions for informed decision-making.
Trend Analysis:
- Moving Averages (MA): The 5-day Moving Average (MA) has been consistently above the Simple Moving Average (SMA) and Exponential Moving Average (EMA) over the past 5 days, indicating a bullish trend.
- MACD: The MACD line has been consistently above the signal line, with both lines showing an upward trend, suggesting bullish momentum.
Momentum Analysis:
- RSI: The Relative Strength Index (RSI) has been fluctuating around the 60-65 range, indicating neutral momentum.
- Stochastic Oscillator: Both %K and %D have been gradually decreasing but remain in the overbought territory, suggesting a potential reversal in momentum.
Volatility Analysis:
- Bollinger Bands (BB): The stock price has been trading within the Bollinger Bands, with the bands narrowing, indicating decreasing volatility and a potential consolidation phase.
Volume Analysis:
- On-Balance Volume (OBV): The OBV has shown a slight increase over the past 5 days, suggesting moderate buying pressure.
- Chaikin Money Flow (CMF): The CMF has been positive, indicating accumulation in the stock.
Conclusion:
Based on the analysis of the technical indicators, the stock is currently exhibiting a bullish trend with positive momentum. However, the decreasing Stochastic Oscillator and narrowing Bollinger Bands suggest a potential consolidation phase in the near term. The moderate increase in OBV and positive CMF indicate underlying buying pressure and accumulation.
Forecast:
Considering the overall bullish trend and positive momentum, the stock price is likely to experience further upside potential in the coming days. Traders may consider buying on dips during consolidation phases for potential long positions. However, it is essential to monitor the Stochastic Oscillator for any signs of a momentum reversal and the Bollinger Bands for potential breakout opportunities.
In conclusion, the stock of VNQI is poised for upward movement in the short term, supported by the technical indicators analyzed. Investors should exercise caution, conduct further research, and consider risk management strategies before making any trading decisions.