Technical Analysis of VNSE 2024-05-10
Overview:
In analyzing the technical indicators for VNSE stock over the last 5 days, we will delve into the trend, momentum, volatility, and volume indicators to provide a comprehensive outlook on the possible stock price movement in the coming days. By examining these key indicators, we aim to offer valuable insights and predictions for potential investors and traders.
Trend Indicators:
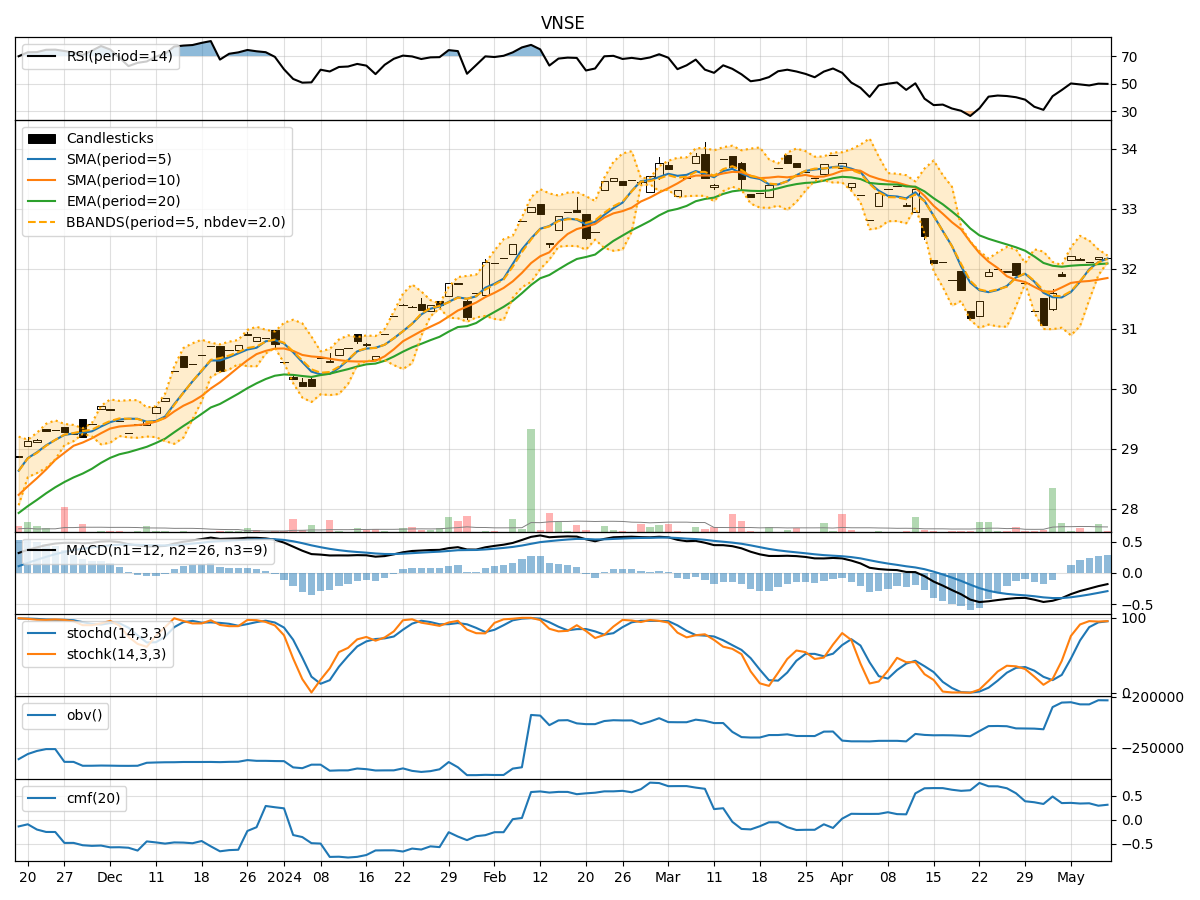
- Moving Averages (MA): The 5-day MA has been consistently above the closing prices, indicating a short-term uptrend.
- MACD: The MACD line has been negative but showing signs of convergence towards the signal line, suggesting a potential reversal in the downtrend.
- RSI: The RSI has been fluctuating around the 50 level, indicating a lack of strong trend direction.
Momentum Indicators:
- Stochastic Oscillator: Both %K and %D have been in overbought territory, signaling a potential reversal or consolidation.
- Williams %R: The indicator has been hovering around oversold levels, suggesting a possible buying opportunity.
Volatility Indicators:
- Bollinger Bands: The bands have been narrowing, indicating decreasing volatility and a potential breakout in the near future.
Volume Indicators:
- On-Balance Volume (OBV): The OBV has been relatively flat, suggesting a balance between buying and selling pressure.
- Chaikin Money Flow (CMF): The CMF has been positive but trending downwards, indicating a potential decrease in buying pressure.
Key Observations:
- The trend indicators show a mixed signal with a potential reversal in the MACD.
- Momentum indicators suggest a possible reversal or consolidation phase.
- Volatility is decreasing, indicating a potential breakout.
- Volume indicators show a balance between buying and selling pressure.
Conclusion:
Based on the analysis of the technical indicators, the stock is likely to experience sideways movement in the coming days with a potential for a bullish breakout due to decreasing volatility and signs of reversal in the MACD. Traders should closely monitor the price action for a clear signal before making any trading decisions.