Technical Analysis of VONE 2024-05-10
Overview:
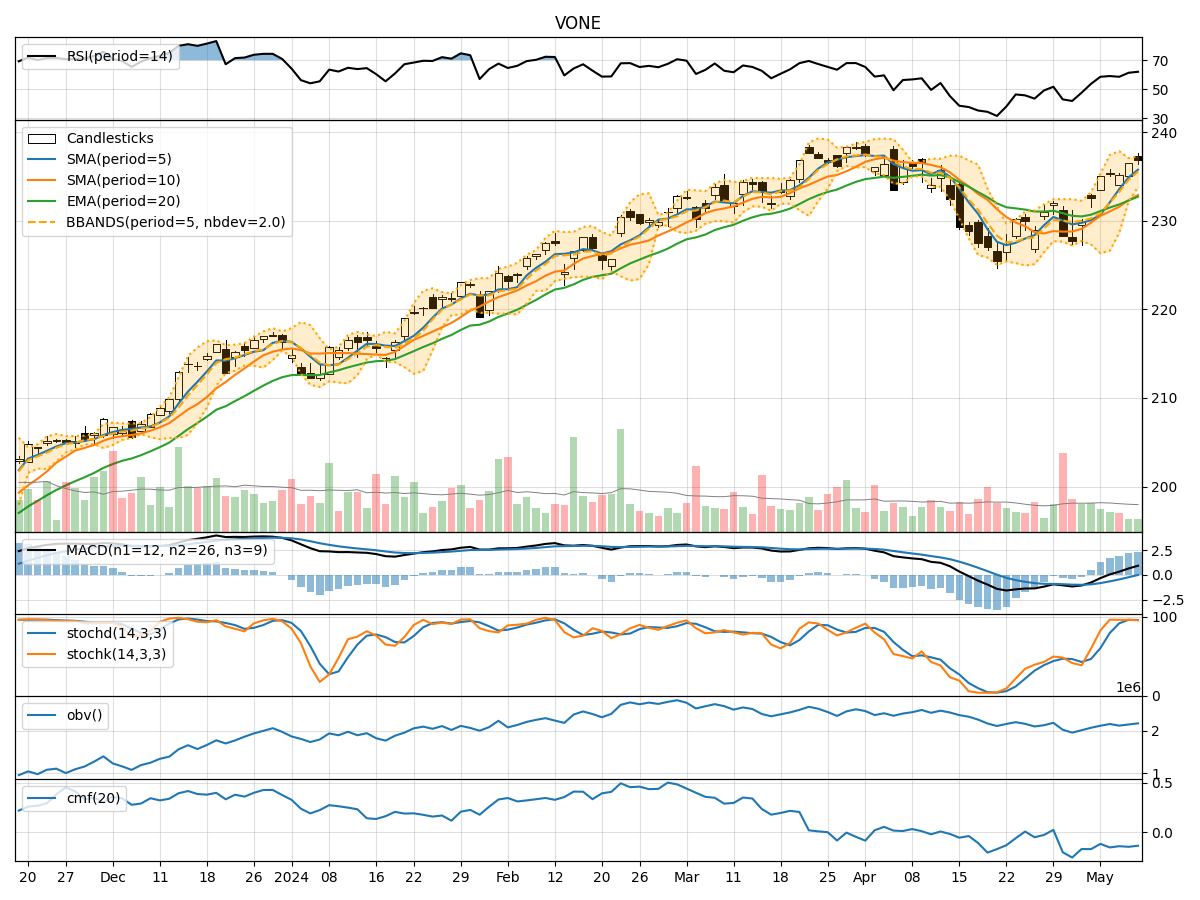
In analyzing the technical indicators for VONE over the last 5 days, we will delve into the trend, momentum, volatility, and volume indicators to provide a comprehensive outlook on the possible stock price movement in the coming days. By examining these key indicators, we aim to offer valuable insights and predictions for potential investors.
Trend Analysis:
- Moving Averages (MA): The 5-day MA has been consistently above the 10-day SMA, indicating a short-term bullish trend. The EMA(20) has been showing an upward trajectory, suggesting a positive momentum in the stock price.
- MACD: The MACD line has been above the signal line for the past 5 days, with the MACD histogram showing an increasing trend, signaling a strengthening bullish momentum.
Momentum Analysis:
- RSI: The RSI has been fluctuating around the 60-62 range, indicating a neutral momentum in the stock price.
- Stochastic Oscillator: Both %K and %D have been hovering in the overbought territory, suggesting a potential reversal or consolidation in the near future.
Volatility Analysis:
- Bollinger Bands (BB): The stock price has been trading within the upper Bollinger Band, indicating an overbought condition. The narrowing of the bands suggests a potential decrease in volatility.
- Bollinger %B: The %B indicator has been above 0.8, indicating a high price relative to the upper band, which may lead to a pullback or consolidation.
Volume Analysis:
- On-Balance Volume (OBV): The OBV has been showing a mixed trend, with some days experiencing selling pressure and others showing accumulation. This indicates indecision among market participants.
- Chaikin Money Flow (CMF): The CMF has been negative over the past 5 days, suggesting a lack of buying pressure in the stock.
Conclusion:
Based on the analysis of the technical indicators, the stock of VONE is currently in a consolidation phase with a slight bullish bias. The trend indicators suggest a positive momentum, supported by the MACD and moving averages. However, the momentum indicators like RSI and Stochastic Oscillator point towards a potential reversal or sideways movement in the short term. The volatility indicators indicate a decrease in volatility, which could lead to a period of consolidation.
Considering the mixed signals from the volume indicators, it is essential to monitor the stock closely for any shifts in buying or selling pressure. In conclusion, the next few days for VONE are likely to see sideways movement with a slight upward bias, as the stock consolidates before potentially resuming its bullish trend. Investors should exercise caution and wait for clearer signals before making significant trading decisions.