Technical Analysis of VOOG 2024-05-10
Overview:
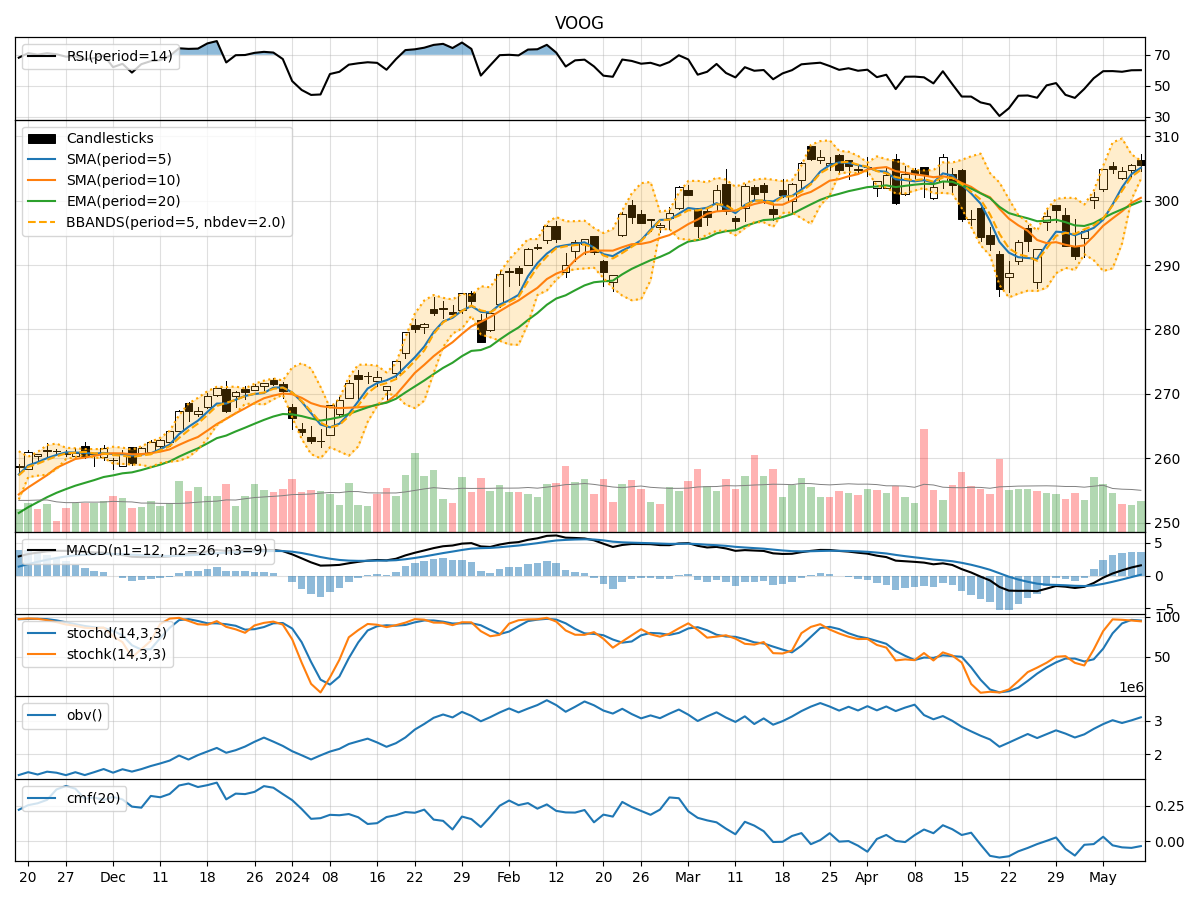
In analyzing the technical indicators for VOOG over the last 5 days, we will delve into the trend, momentum, volatility, and volume indicators to provide a comprehensive outlook on the possible stock price movement in the coming days.
Trend Indicators:
- Moving Averages (MA): The 5-day MA has been consistently above the 10-day SMA, indicating a short-term bullish trend. The EMA(20) has also been trending upwards, supporting a positive momentum.
- MACD: The MACD line has been above the signal line for the past few days, suggesting bullish momentum in the stock.
- Conclusion: The trend indicators point towards an upward trend in the stock price.
Momentum Indicators:
- RSI: The RSI has been hovering around the 60 level, indicating a neutral momentum in the stock.
- Stochastic Oscillator: Both %K and %D have been in the overbought zone, suggesting a potential reversal in the short term.
- Conclusion: The momentum indicators suggest a neutral to slightly bearish momentum in the stock.
Volatility Indicators:
- Bollinger Bands: The stock price has been trading within the Bollinger Bands, with the bands narrowing in the last few days, indicating decreasing volatility.
- Conclusion: Volatility is decreasing, which could lead to a period of consolidation or sideways movement in the stock price.
Volume Indicators:
- On-Balance Volume (OBV): The OBV has been fluctuating but generally trending downwards, indicating selling pressure in the stock.
- Chaikin Money Flow (CMF): The CMF has been negative, suggesting a bearish money flow in the stock.
- Conclusion: Volume indicators point towards bearish sentiment in the stock.
Conclusion:
Based on the analysis of the technical indicators, the trend indicators suggest an upward trend in the stock price, while momentum indicators indicate a neutral to slightly bearish momentum. Volatility is decreasing, signaling a potential period of consolidation or sideways movement. However, volume indicators point towards bearish sentiment in the stock.
Overall View:
Considering the mixed signals from the different indicators, it is crucial to monitor the stock closely in the coming days. Investors should exercise caution and consider potential profit-taking opportunities in the short term. The stock may experience some consolidation before potentially resuming its upward trend.