Technical Analysis of VOOV 2024-05-10
Overview:
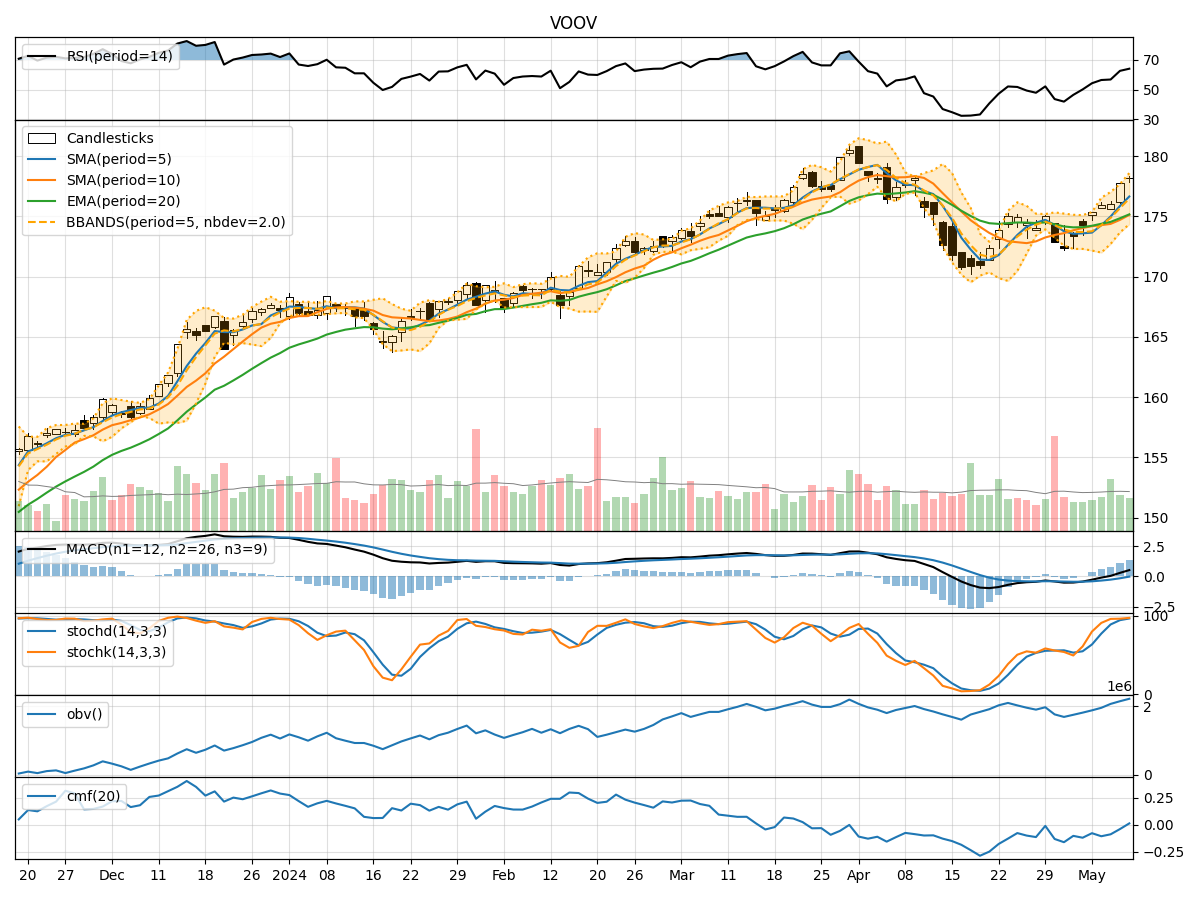
In analyzing the technical indicators for VOOV over the last 5 days, we will delve into the trends, momentum, volatility, and volume aspects to provide a comprehensive outlook on the possible stock price movement in the coming days. By examining key indicators such as moving averages, MACD, RSI, Bollinger Bands, and OBV, we aim to offer valuable insights and predictions for informed decision-making.
Trend Analysis:
- Moving Averages (MA): The 5-day MA has been consistently trending upwards, indicating a bullish momentum in the short term.
- MACD: The MACD line has been above the signal line for the past 5 days, suggesting a positive trend in momentum.
Key Observation: The trend indicators point towards a bullish sentiment in the stock price movement.
Momentum Analysis:
- RSI: The RSI values have been increasing steadily, reaching above 50, which indicates growing buying pressure.
- Stochastic Oscillator: Both %K and %D values are in the overbought territory, signaling a potential reversal or consolidation.
Key Observation: Momentum indicators suggest a mixed sentiment with a possibility of a short-term pullback.
Volatility Analysis:
- Bollinger Bands: The stock price has been trading near the upper Bollinger Band, indicating high volatility and a potential overbought condition.
Key Observation: Volatility indicators signal a high volatility environment, which may lead to a price correction.
Volume Analysis:
- On-Balance Volume (OBV): The OBV values have been increasing, reflecting accumulation by investors.
Key Observation: Volume indicators show positive accumulation, supporting the bullish sentiment.
Conclusion:
Based on the analysis of trend, momentum, volatility, and volume indicators, the next few days' possible stock price movement for VOOV is likely to be upward in the short term. However, considering the overbought conditions indicated by the stochastic oscillator and Bollinger Bands, a temporary pullback or consolidation may occur before the uptrend resumes. Traders should closely monitor key support and resistance levels for potential entry and exit points.
Key Recommendations:
- Consider taking profits: Traders holding long positions may consider taking partial profits to lock in gains.
- Monitor for reversal signals: Watch for signs of a potential trend reversal, especially if the stochastic oscillator crosses below the overbought zone.
- Use stop-loss orders: Implementing stop-loss orders can help manage risk in case of unexpected price movements.
In summary, while the overall outlook for VOOV is bullish, caution is advised due to the high volatility and potential for a short-term correction. Stay vigilant and adapt your trading strategy accordingly to navigate the market dynamics effectively.