Technical Analysis of VOTE 2024-05-10
Overview:
In analyzing the technical indicators for VOTE stock over the last 5 days, we will delve into the trend, momentum, volatility, and volume indicators to provide a comprehensive outlook on the possible stock price movement in the coming days. By examining key metrics such as moving averages, MACD, RSI, Bollinger Bands, and OBV, we aim to offer valuable insights and predictions for informed decision-making.
Trend Indicators:
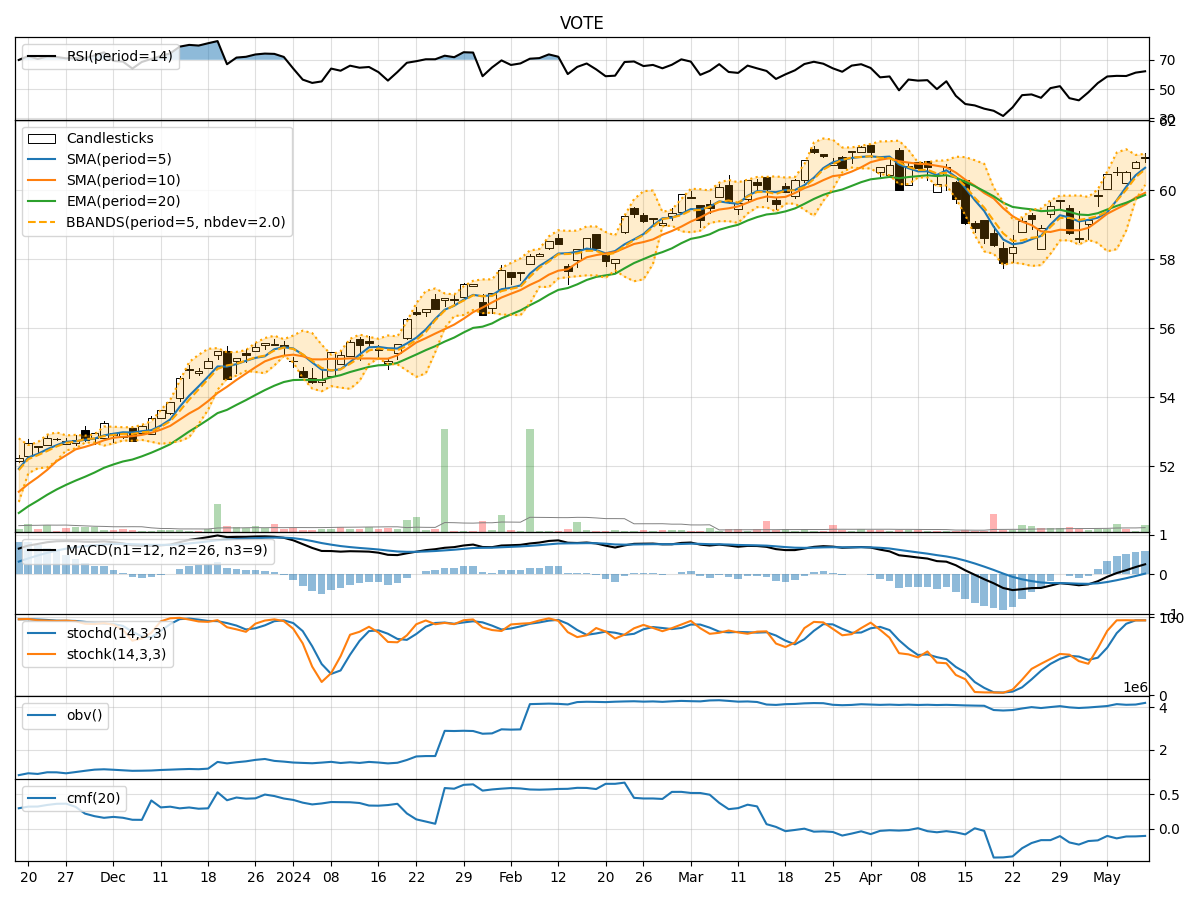
- Moving Averages (MA): The 5-day moving average has been consistently trending upwards, indicating a positive momentum in the stock price.
- MACD: The MACD line has been consistently above the signal line, suggesting a bullish trend in the stock.
- EMA: The exponential moving average has also been on an upward trajectory, supporting the bullish sentiment in the stock.
Momentum Indicators:
- RSI: The Relative Strength Index has been in the overbought territory, indicating a strong bullish momentum in the stock.
- Stochastic Oscillator: Both %K and %D have been in the overbought zone, signaling a potential reversal or consolidation in the stock price.
- Williams %R: The Williams %R is in the oversold region, suggesting a possible pullback in the stock price.
Volatility Indicators:
- Bollinger Bands: The stock price has been trading close to the upper Bollinger Band, indicating high volatility and a potential overbought condition.
- Bollinger Band Width: The band width has been narrowing, suggesting a decrease in volatility and a possible period of consolidation.
- Bollinger Band %B: The %B indicator is above 0.8, indicating an overbought condition in the stock.
Volume Indicators:
- On-Balance Volume (OBV): The OBV has shown mixed signals with fluctuations, indicating indecision among investors.
- Chaikin Money Flow (CMF): The CMF has been negative, suggesting a lack of buying pressure in the stock.
Conclusion:
Based on the analysis of the technical indicators, the stock is currently exhibiting strong bullish momentum but is also showing signs of being overbought and potentially reaching a reversal point. The narrowing Bollinger Bands and the overbought readings on the stochastic oscillator and RSI indicate a possible consolidation or pullback in the stock price in the coming days. Therefore, it is advisable to exercise caution and consider taking profits or implementing risk management strategies in anticipation of a potential downward correction. A short-term downward correction or consolidation is likely in the next few days.