Technical Analysis of VPL 2024-05-10
Overview:
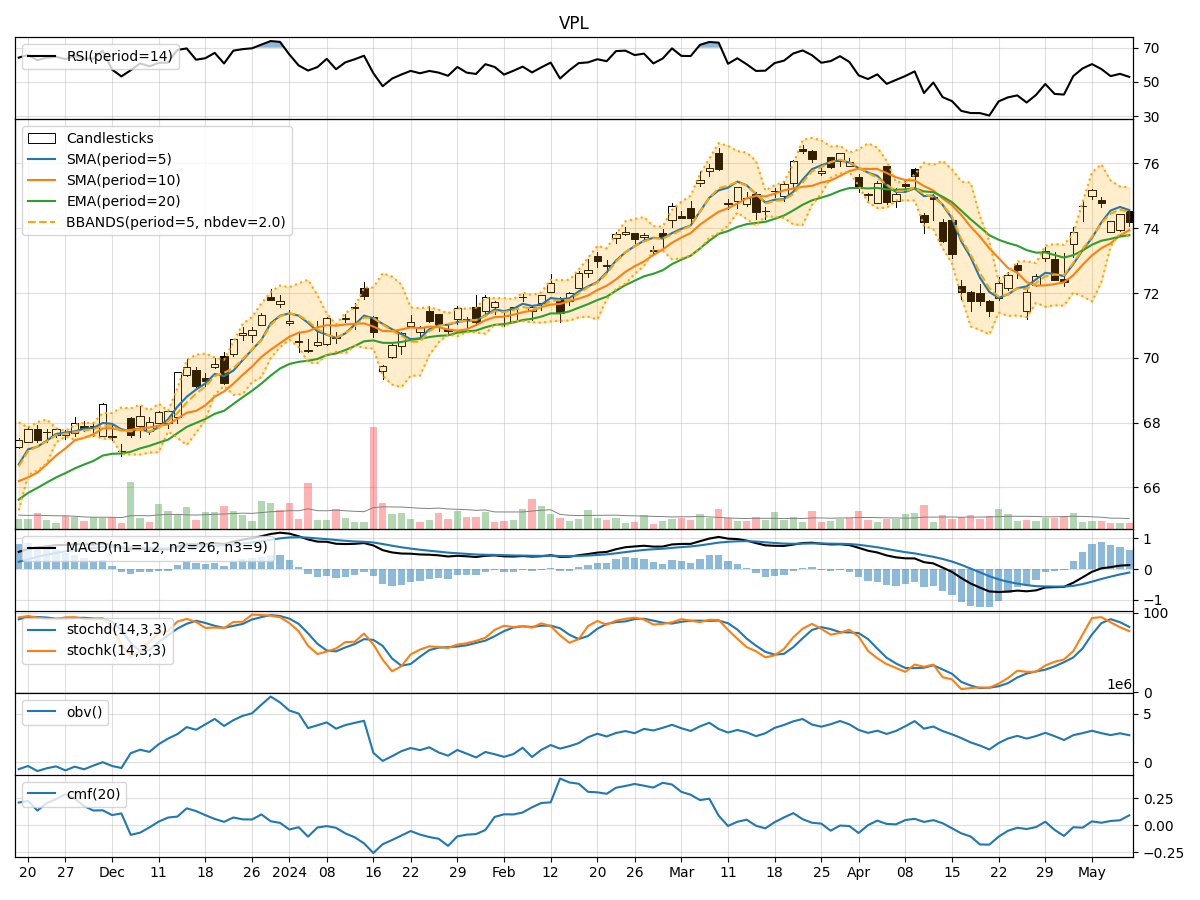
In analyzing the technical indicators for VPL over the last 5 days, we will delve into the trend, momentum, volatility, and volume indicators to provide a comprehensive outlook on the possible stock price movement in the coming days.
Trend Analysis:
- Moving Averages (MA): The 5-day Moving Average (MA) has been consistently above the Simple Moving Average (SMA) and Exponential Moving Average (EMA), indicating a bullish trend.
- MACD: The MACD line has been consistently above the signal line, suggesting a bullish momentum in the stock price.
- RSI: The Relative Strength Index (RSI) has been fluctuating around the neutral zone, indicating a balanced momentum in the stock.
Momentum Analysis:
- Stochastic Oscillator: The Stochastic Oscillator has been gradually decreasing but remains in the overbought territory, signaling a potential reversal in the stock price.
- Williams %R: The Williams %R indicator has been consistently in the oversold region, suggesting a possible bullish reversal in the near future.
Volatility Analysis:
- Bollinger Bands: The Bollinger Bands have been narrowing, indicating decreasing volatility in the stock price.
- Average True Range (ATR): The ATR has been relatively stable, suggesting a consistent level of volatility in the stock.
Volume Analysis:
- On-Balance Volume (OBV): The OBV indicator has been fluctuating, indicating a balance between buying and selling pressure in the stock.
- Chaikin Money Flow (CMF): The CMF has been positive, suggesting a bullish money flow into the stock.
Key Observations:
- The trend indicators suggest a bullish sentiment in the stock price.
- Momentum indicators show a potential reversal in the overbought conditions.
- Volatility indicators point towards decreasing volatility.
- Volume indicators indicate a balanced buying and selling pressure.
Conclusion:
Based on the analysis of the technical indicators, the next few days' possible stock price movement for VPL is likely to be bullish with a potential short-term correction due to the overbought conditions indicated by the Stochastic Oscillator. Traders may consider entering long positions with caution, keeping an eye on the momentum indicators for any signs of a reversal. Overall, the stock is expected to continue its upward trend in the near future.