Technical Analysis of VPU 2024-05-10
Overview:
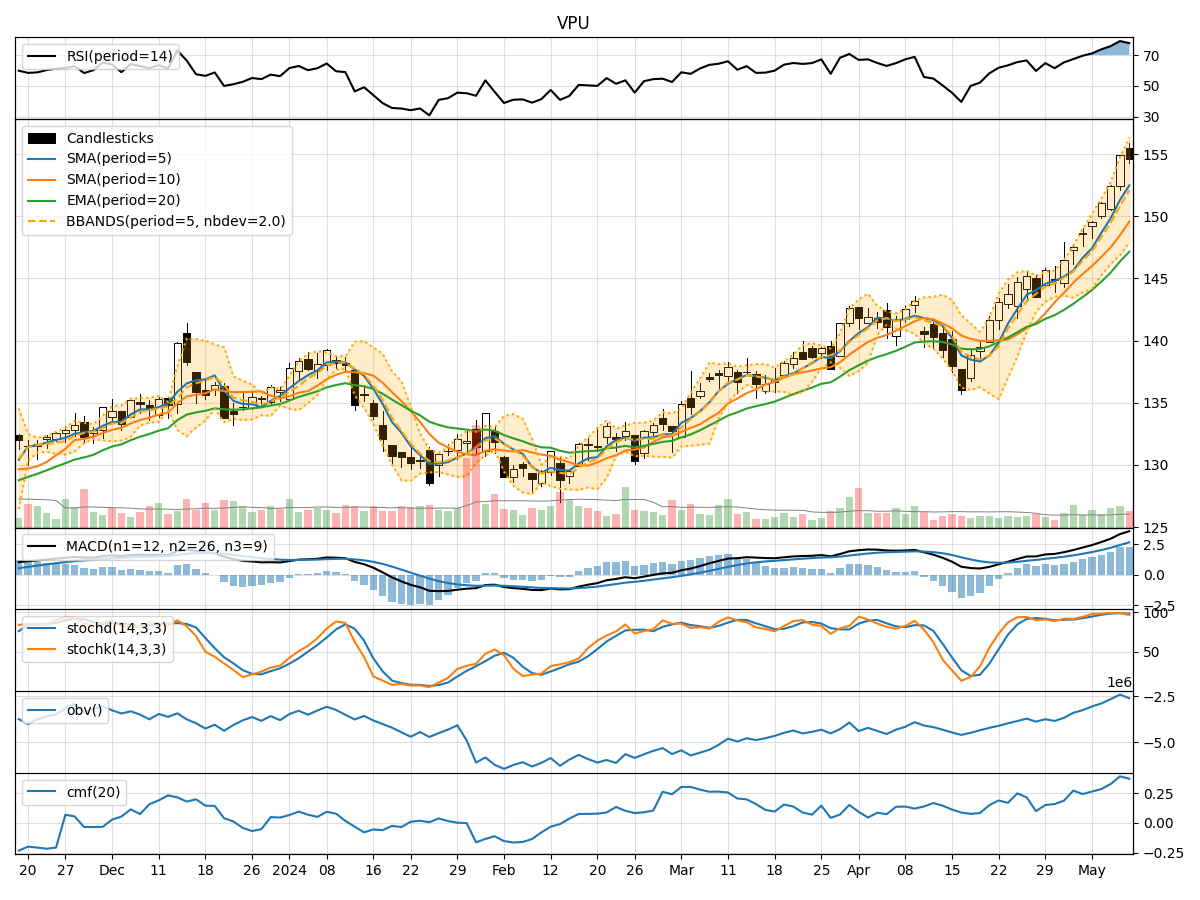
In analyzing the technical indicators for VPU over the last 5 days, we will delve into the trend, momentum, volatility, and volume indicators to provide a comprehensive outlook on the possible stock price movement in the coming days. By examining these key indicators, we aim to offer valuable insights and predictions for informed decision-making.
Trend Indicators:
- Moving Averages (MA): The 5-day MA has been consistently rising, indicating a bullish trend in the short term.
- MACD: The MACD line has been increasing, showing bullish momentum.
- EMA: The EMA has been trending upwards, supporting the bullish sentiment.
Key Observation: The trend indicators suggest a strong bullish trend in the stock price.
Momentum Indicators:
- RSI: The RSI has been increasing, indicating strengthening bullish momentum.
- Stochastic Oscillator: Both %K and %D have been high, signaling overbought conditions.
- Williams %R: The indicator has been in the oversold territory, suggesting a potential reversal.
Key Observation: Momentum indicators reflect strong bullish momentum but also indicate potential overbought conditions.
Volatility Indicators:
- Bollinger Bands (BB): The stock price has been trading near the upper Bollinger Band, indicating high volatility.
Key Observation: Volatility is high, which may lead to sharp price movements in the short term.
Volume Indicators:
- On-Balance Volume (OBV): The OBV has been increasing, showing accumulation by investors.
- Chaikin Money Flow (CMF): The CMF has been positive, indicating buying pressure.
Key Observation: Volume indicators suggest increasing buying interest in the stock.
Conclusion:
Based on the analysis of the technical indicators, the stock of VPU is currently in a strong bullish trend with positive momentum and increasing buying interest. However, the overbought conditions indicated by the stochastic oscillator and the high volatility observed with the Bollinger Bands suggest a potential for a short-term pullback or consolidation.
Forecast:
Considering the overall bullish sentiment but acknowledging the possibility of a short-term correction due to overbought conditions and high volatility, the next few days may see a slight pullback or consolidation before the uptrend resumes. Traders should be cautious of potential profit-taking or a temporary reversal in the stock price.
Recommendation:
- Short-term Traders: Consider taking profits or setting tight stop-loss orders to protect gains during a potential pullback.
- Long-term Investors: Hold onto positions, considering the strong bullish trend and positive momentum in the stock.
Disclaimer:
Remember that market dynamics can change rapidly, and it is essential to monitor the stock closely for any signs of a trend reversal. Technical analysis provides insights based on historical data and indicators, but it is not a guarantee of future price movements. Make sure to conduct thorough research and consider other factors before making investment decisions.