Technical Analysis of VRP 2024-05-10
Overview:
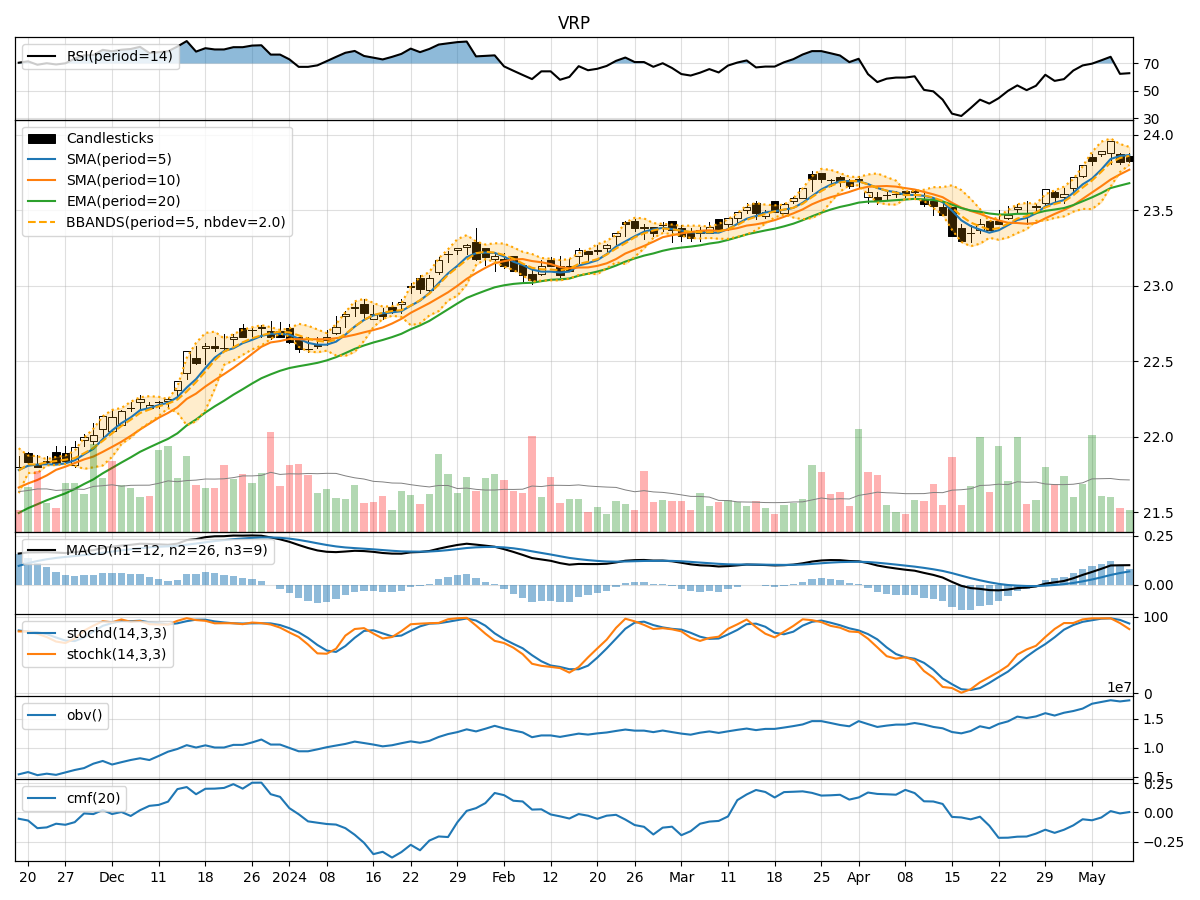
In the last 5 trading days, the stock has shown a consistent uptrend in terms of closing prices. The moving averages (MA) have been trending upwards, indicating a positive momentum. The Relative Strength Index (RSI) has been fluctuating but generally staying within the overbought territory. Volatility has been relatively stable, and the On-Balance Volume (OBV) has shown a slight increase.
Trend Indicators Analysis:
- Moving Averages (MA): The 5-day MA has been consistently above the 10-day Simple Moving Average (SMA), indicating a short-term bullish trend. The Exponential Moving Average (EMA) has also been trending upwards, supporting the bullish sentiment.
- MACD: The MACD line has been above the signal line, suggesting a bullish momentum. The MACD Histogram has been increasing, indicating strengthening bullish momentum.
Momentum Indicators Analysis:
- RSI: The RSI has been fluctuating in the overbought territory, suggesting a potential overvaluation of the stock. However, it has not crossed below 70, indicating continued bullish momentum.
- Stochastic Oscillator: Both %K and %D have been decreasing, moving away from the overbought zone. This could signal a potential reversal in momentum.
- Williams %R: The Williams %R has been fluctuating in the oversold territory, indicating a potential buying opportunity.
Volatility Indicators Analysis:
- Bollinger Bands (BB): The stock price has been trading within the Bollinger Bands, with the bands narrowing slightly. This could indicate a period of consolidation or reduced volatility.
- Bollinger %B: The %B indicator has been relatively stable, hovering around the middle line. This suggests a balanced market sentiment without any extreme bullish or bearish signals.
Volume Indicators Analysis:
- On-Balance Volume (OBV): The OBV has shown a slight increase over the last 5 days, indicating that volume has been higher on up days compared to down days. This could support the bullish trend.
- Chaikin Money Flow (CMF): The CMF has been negative, indicating some selling pressure. However, the recent uptick in OBV suggests that buying interest may be picking up.
Conclusion:
Based on the analysis of the technical indicators, the stock is currently in a bullish phase with strong upward momentum. The trend indicators, such as moving averages and MACD, support a continuation of the uptrend. However, the overbought RSI and potential reversal signals from the Stochastic Oscillator suggest a possible short-term correction or consolidation.
Considering the overall picture, the stock is likely to experience some consolidation or a minor pullback in the next few days before potentially resuming its upward trajectory. Traders should watch for key support levels and monitor the momentum indicators for any signs of a trend reversal. Long-term investors may use any dips as buying opportunities to capitalize on the overall bullish trend.