Technical Analysis of VSGX 2024-05-10
Overview:
In analyzing the technical indicators for VSGX over the last 5 days, we will delve into the trend, momentum, volatility, and volume indicators to provide a comprehensive outlook on the possible stock price movement in the coming days. By examining these key indicators, we aim to offer valuable insights and predictions for informed decision-making.
Trend Analysis:
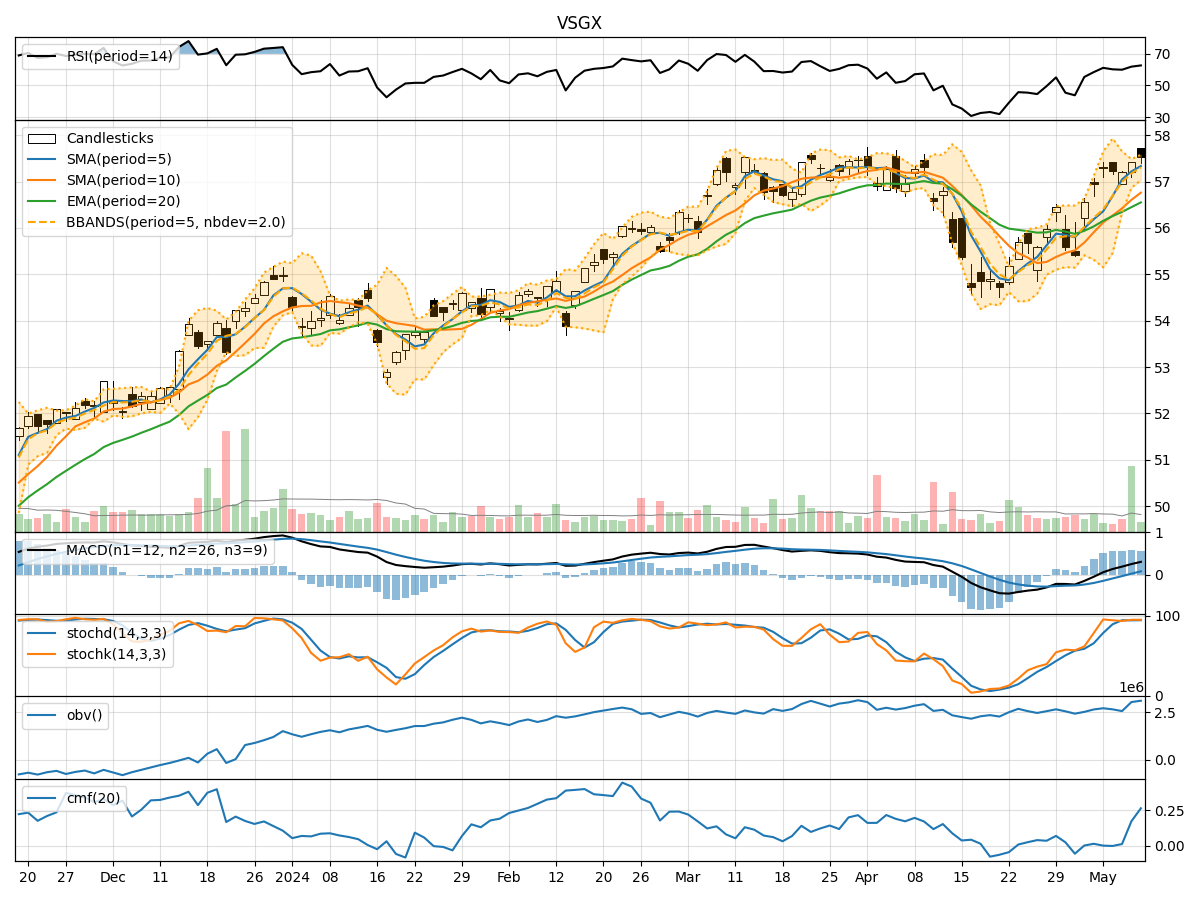
- Moving Averages (MA): The 5-day MA has been consistently above the 10-day SMA, indicating a short-term bullish trend. The EMA(20) has been steadily increasing, reflecting positive momentum.
- MACD: The MACD line has been above the signal line, suggesting bullish momentum in the stock price.
- Conclusion: The trend indicators point towards an upward trajectory for VSGX.
Momentum Analysis:
- RSI: The RSI has been in the overbought territory, indicating strong buying pressure.
- Stochastic Oscillator: Both %K and %D have been in the overbought zone, signaling a potential reversal.
- Williams %R: The indicator has been fluctuating around oversold levels, suggesting a mixed sentiment.
- Conclusion: Momentum indicators suggest a potential pullback or consolidation in the near term.
Volatility Analysis:
- Bollinger Bands: The stock price has been trading within the bands, with the %B indicator hovering around 0.8, indicating an uptrend.
- Conclusion: Volatility remains relatively stable, with the stock likely to continue its upward movement within the bands.
Volume Analysis:
- On-Balance Volume (OBV): The OBV has shown an increasing trend, reflecting strong buying interest.
- Chaikin Money Flow (CMF): The CMF has been positive, indicating accumulation by investors.
- Conclusion: Volume indicators support the bullish outlook for VSGX.
Overall Conclusion:
Based on the analysis of trend, momentum, volatility, and volume indicators, the overall outlook for VSGX is bullish in the short term. The stock is likely to experience further upside potential, supported by positive trends in moving averages, MACD, RSI, OBV, and CMF. However, caution is advised as momentum indicators suggest a possible pullback or consolidation before resuming the upward trend.
Recommendation:
- Short-term Traders: Consider taking profits or tightening stop-loss levels to manage potential downside risks during a consolidation phase.
- Long-term Investors: Hold positions with a focus on capitalizing on the overall bullish trend in VSGX.
In conclusion, while the stock shows strong bullish momentum, it is essential to monitor key support and resistance levels along with any signs of reversal in momentum indicators. Stay vigilant and adapt your strategy accordingly to navigate potential market fluctuations.