Technical Analysis of VSHY 2024-05-10
Overview:
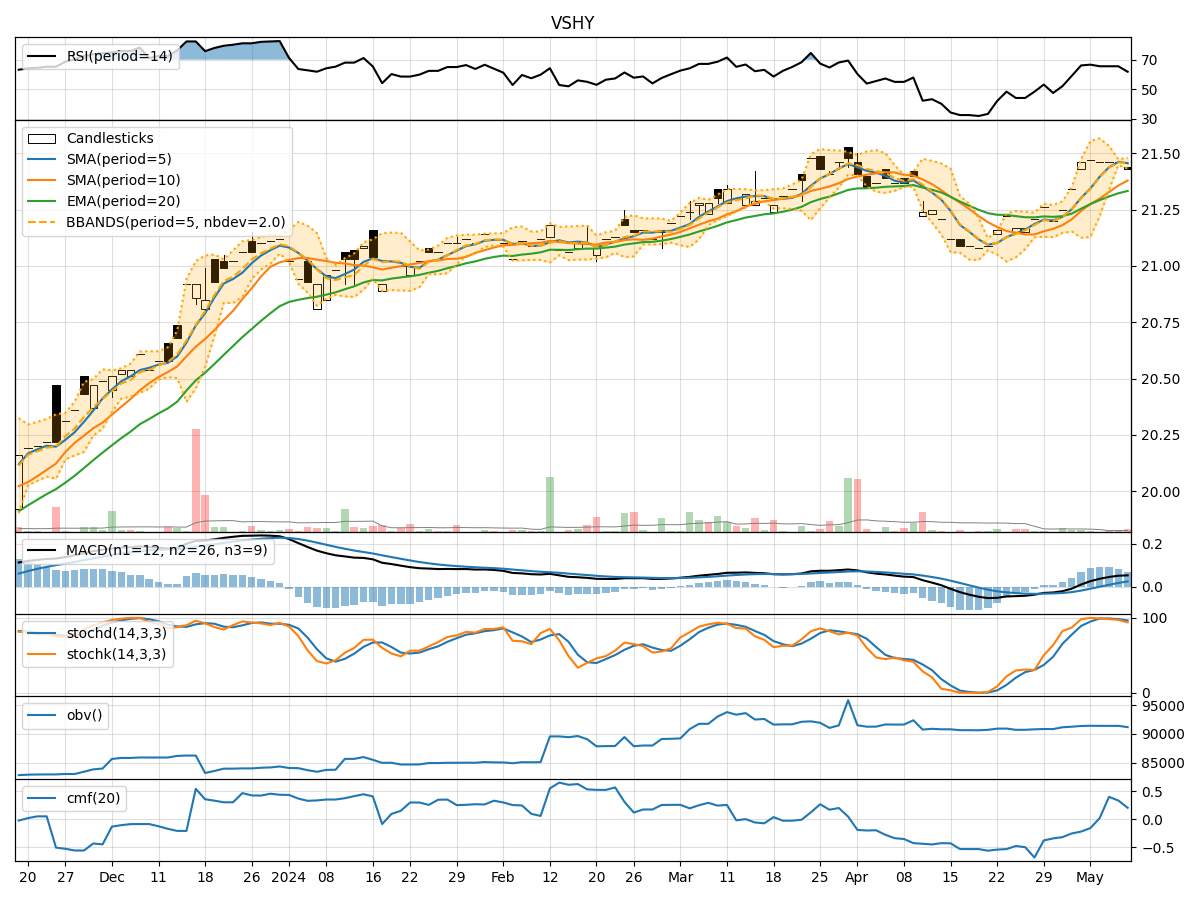
In analyzing the technical indicators for VSHY over the last 5 days, we will delve into the trend, momentum, volatility, and volume indicators to provide a comprehensive outlook on the possible stock price movement in the coming days. By examining these key aspects, we aim to offer valuable insights and recommendations for potential investors.
Trend Indicators:
- Moving Averages (MA): The 5-day MA has been consistently above the closing price, indicating a short-term uptrend.
- MACD: The MACD line has been trending upwards, with the MACD histogram showing positive values, suggesting bullish momentum.
- EMA: The EMA has been steadily increasing, supporting the bullish trend.
Key Observation: The trend indicators point towards a bullish sentiment in the short term.
Momentum Indicators:
- RSI: The RSI has been in the overbought territory but has shown some slight decrease, indicating a potential cooling off of buying pressure.
- Stochastic Oscillator: Both %K and %D have been gradually decreasing, signaling a potential shift towards a bearish momentum.
- Williams %R: The indicator has been in the oversold region, suggesting a possible reversal in the near future.
Key Observation: Momentum indicators are showing signs of potential reversal from overbought conditions.
Volatility Indicators:
- Bollinger Bands (BB): The stock price has been trading within the bands, with the bands narrowing, indicating decreasing volatility.
- BB %B: The %B indicator is hovering around the middle, suggesting a balanced market sentiment.
Key Observation: Volatility indicators point towards a consolidation phase with decreasing volatility.
Volume Indicators:
- On-Balance Volume (OBV): The OBV has been relatively flat, indicating a balance between buying and selling pressure.
- Chaikin Money Flow (CMF): The CMF has shown a positive trend, reflecting accumulation by investors.
Key Observation: Volume indicators suggest a neutral stance with no clear dominance of buying or selling pressure.
Conclusion:
Based on the analysis of the technical indicators, the next few days for VSHY could see a sideways movement with a potential for a bearish reversal in momentum. The trend remains bullish in the short term, but the momentum indicators hint at a possible shift. Volatility is decreasing, indicating a period of consolidation, while volume indicators suggest a balanced market sentiment.
Overall View: The stock is likely to experience a period of consolidation with a potential for a bearish bias in the near term. Investors should closely monitor the momentum indicators for any confirmation of a reversal and adjust their strategies accordingly.