Technical Analysis of VSMV 2024-05-10
Overview:
In analyzing the technical indicators for VSMV over the last 5 days, we will delve into the trend, momentum, volatility, and volume indicators to provide a comprehensive outlook on the possible stock price movement in the coming days. By examining these key aspects, we aim to offer valuable insights and predictions for informed decision-making.
Trend Indicators:
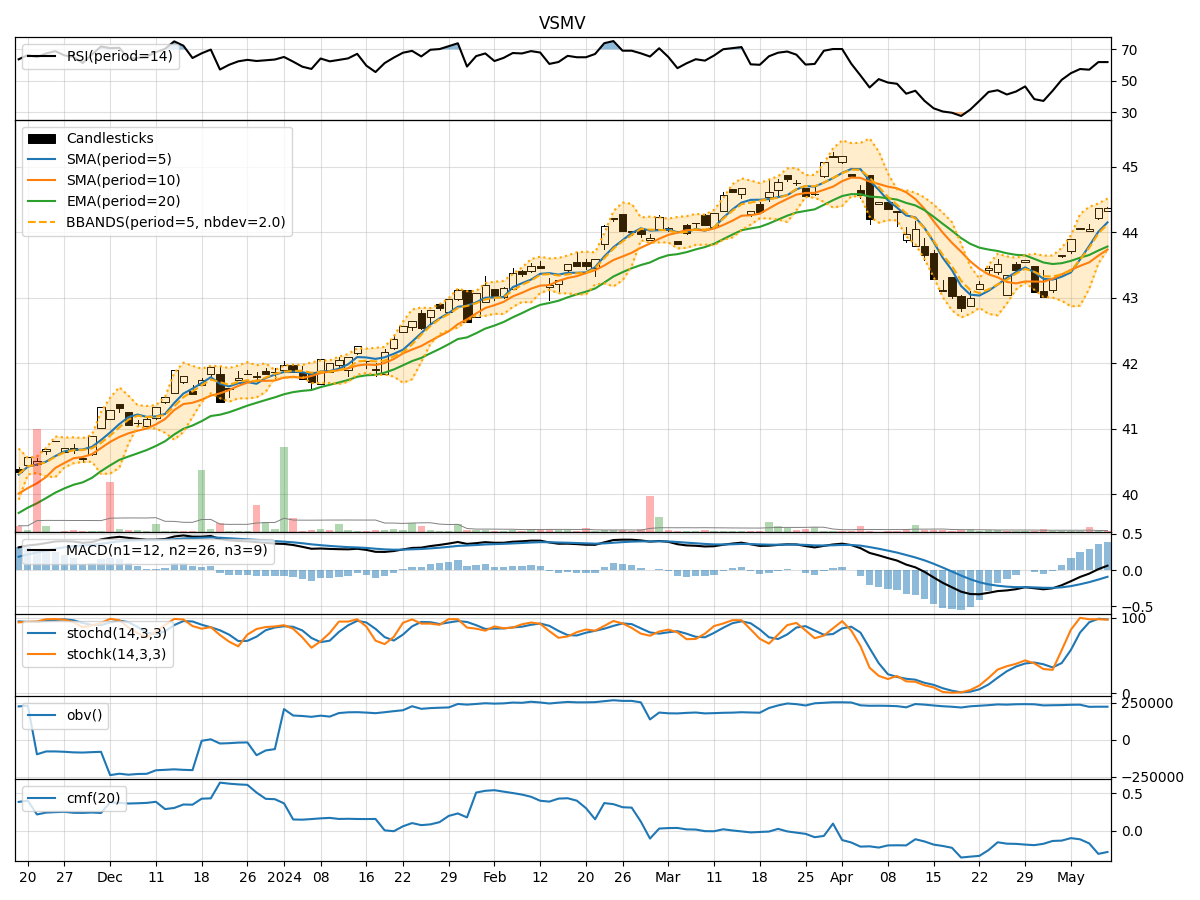
- Moving Averages (MA): The 5-day MA has been consistently above the SMA(10) and EMA(20), indicating a short-term bullish trend.
- MACD: The MACD line has been above the signal line for the past 5 days, suggesting positive momentum.
- MACD Histogram: The MACD histogram has been increasing, indicating strengthening bullish momentum.
Key Observation: The trend indicators suggest a bullish sentiment in the short term.
Momentum Indicators:
- RSI: The RSI has been fluctuating in the overbought territory, indicating strong buying pressure.
- Stochastic Oscillator: Both %K and %D have been in the overbought zone, signaling a potential reversal.
- Williams %R: The indicator has been hovering near the oversold region, suggesting a possible buying opportunity.
Key Observation: Momentum indicators show conflicting signals, with RSI indicating strength and Stochastic suggesting a reversal.
Volatility Indicators:
- Bollinger Bands: The price has been trading within the bands, indicating normal volatility.
- Bollinger %B: The %B is around 0.8, suggesting the stock is trading near the upper band.
- Average True Range (ATR): The ATR value has been relatively stable, indicating consistent volatility levels.
Key Observation: Volatility indicators imply a stable price movement with no extreme fluctuations.
Volume Indicators:
- On-Balance Volume (OBV): The OBV has been fluctuating, indicating mixed buying and selling pressure.
- Chaikin Money Flow (CMF): The CMF has been negative, suggesting outflow of money from the stock.
Key Observation: Volume indicators reflect a lack of strong buying interest and a potential bearish sentiment.
Conclusion:
Based on the analysis of the technical indicators, the stock price of VSMV is likely to experience a short-term upward movement due to the bullish trend indicated by moving averages and MACD. However, the conflicting signals from momentum indicators and the negative CMF suggest a possible consolidation or sideways movement in the near future. Traders should exercise caution and closely monitor key support and resistance levels for potential entry or exit points.
Recommendation:
- Short-term Traders: Consider taking profits as the stock may enter a consolidation phase.
- Long-term Investors: Monitor the price action for a clearer trend confirmation before making significant investment decisions.
Always remember to conduct further research and consider fundamental factors before making any investment decisions.