Technical Analysis of VTES 2024-05-10
Overview:
In analyzing the technical indicators for VTES over the last 5 days, we will delve into the trend, momentum, volatility, and volume indicators to provide a comprehensive outlook on the possible stock price movement in the coming days. By examining these key aspects, we aim to offer valuable insights and predictions for potential investors and traders.
Trend Analysis:
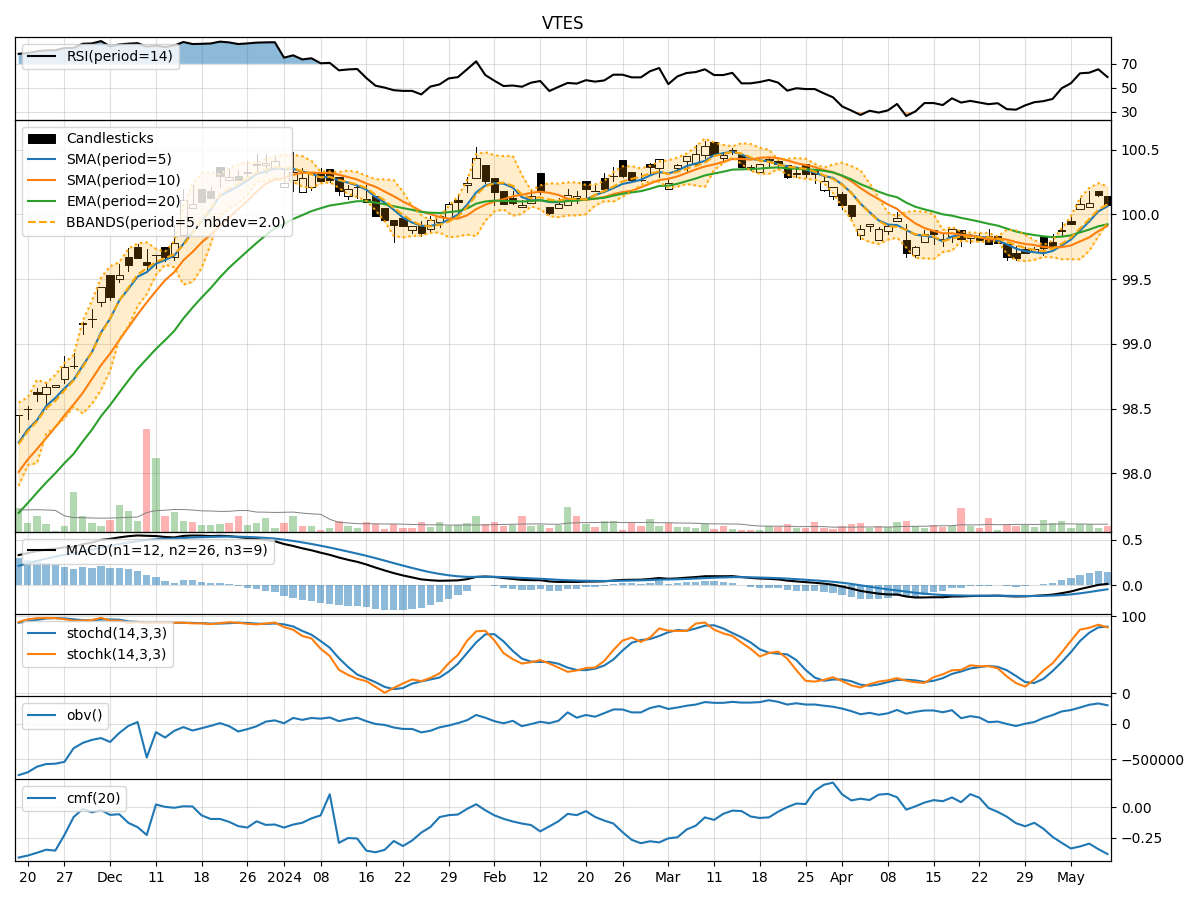
- Moving Averages (MA): The 5-day Moving Average (MA) has been consistently above the Simple Moving Average (SMA) and Exponential Moving Average (EMA), indicating a short-term bullish trend.
- MACD: The Moving Average Convergence Divergence (MACD) has shown positive values, with the MACD line above the signal line, suggesting bullish momentum.
Momentum Analysis:
- RSI: The Relative Strength Index (RSI) has been fluctuating around the 60-70 range, indicating a neutral momentum.
- Stochastic Oscillator: Both %K and %D values have been relatively high, suggesting potential overbought conditions.
Volatility Analysis:
- Bollinger Bands (BB): The stock price has mostly stayed within the Bollinger Bands, with the bands narrowing, indicating decreasing volatility.
Volume Analysis:
- On-Balance Volume (OBV): The OBV has shown a slight increase, suggesting some accumulation by investors.
- Chaikin Money Flow (CMF): The CMF has been negative, indicating a bearish money flow trend.
Key Observations:
- The trend indicators suggest a bullish sentiment in the short term.
- Momentum indicators show a neutral stance with a potential for overbought conditions.
- Volatility has been decreasing, indicating a possible period of consolidation.
- Volume indicators reflect a slight accumulation but with a bearish money flow trend.
Conclusion:
Based on the analysis of the technical indicators, the next few days for VTES could see sideways movement with a slight bullish bias. Traders may expect the stock price to consolidate within a narrow range, potentially testing resistance levels. However, caution is advised due to the neutral momentum and potential overbought conditions indicated by the stochastic oscillator. It is essential to monitor the price action closely for any signs of a breakout or reversal.
In summary, while the trend indicators point towards a bullish outlook, the overall market dynamics suggest a period of consolidation with limited volatility. Investors should remain vigilant and consider implementing risk management strategies to navigate potential market fluctuations effectively.