Technical Analysis of VTHR 2024-05-10
Overview:
In analyzing the technical indicators for VTHR over the last 5 days, we will delve into the trend, momentum, volatility, and volume indicators to provide a comprehensive outlook on the possible stock price movement in the coming days.
Trend Indicators:
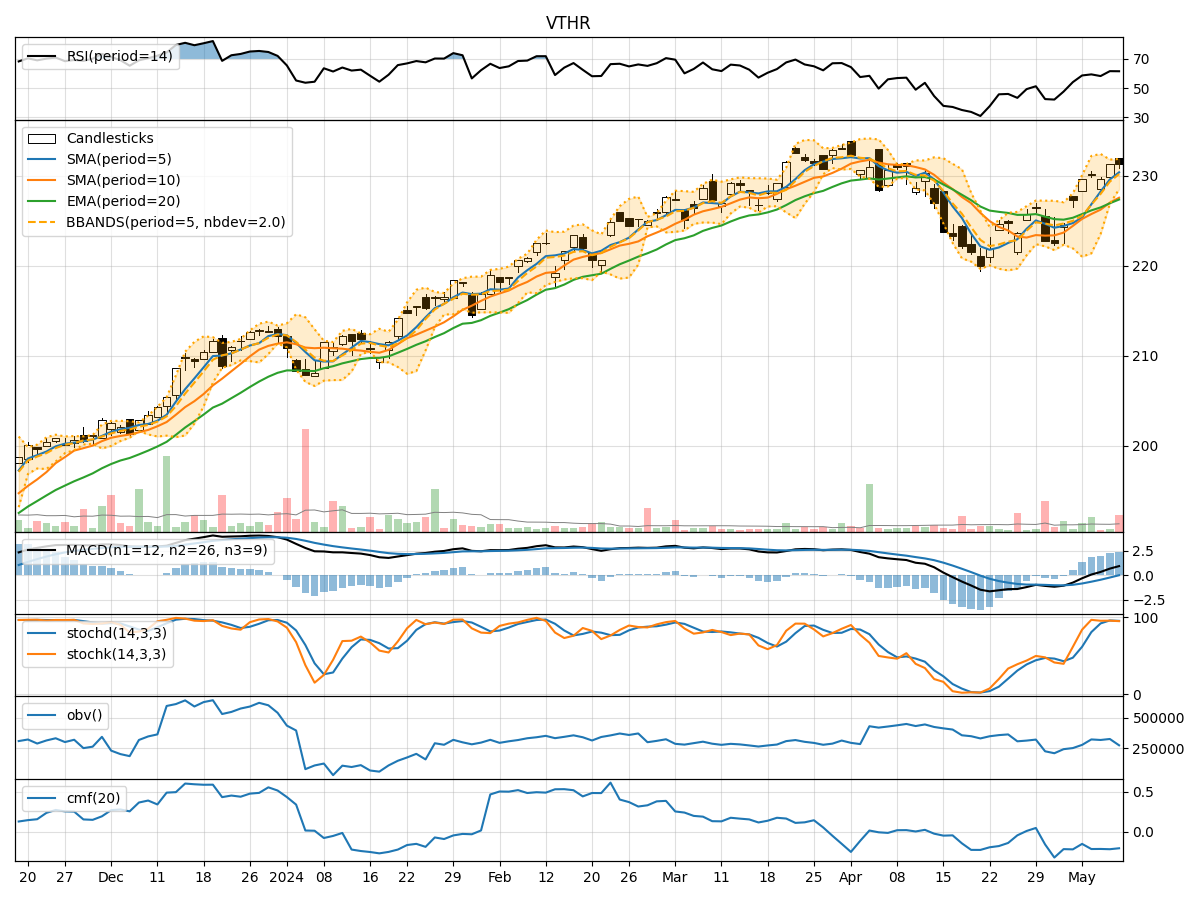
- Moving Averages (MA): The 5-day MA has been consistently above the 10-day SMA, indicating a short-term bullish trend. The EMA(20) has been showing an upward trajectory, supporting the bullish sentiment.
- MACD: The MACD line has been above the signal line for the past 5 days, with both lines trending upwards. This suggests a continuation of the bullish momentum.
- RSI: The RSI has been fluctuating around the 60-65 range, indicating a moderate level of buying pressure.
Momentum Indicators:
- Stochastic Oscillator: Both %K and %D have been in the overbought zone, suggesting a strong bullish momentum.
- Williams %R: The indicator has been hovering around the oversold territory, indicating a potential reversal in the short term.
Volatility Indicators:
- Bollinger Bands: The stock price has been trading within the bands, with the %B indicator showing a slight deviation from the upper band. This could signal a potential pullback or consolidation.
- Average True Range (ATR): The ATR has been relatively stable, indicating consistent price movement without significant spikes.
Volume Indicators:
- On-Balance Volume (OBV): The OBV has shown mixed signals, with some days recording positive volume while others showing negative volume. This suggests indecision among market participants.
- Chaikin Money Flow (CMF): The CMF has been consistently negative, indicating a lack of buying pressure in the market.
Key Observations:
- The trend indicators point towards a bullish sentiment, supported by moving averages and MACD.
- Momentum indicators suggest a strong bullish momentum in the short term.
- Volatility indicators indicate a potential consolidation or pullback in the stock price.
- Volume indicators show mixed signals, reflecting uncertainty among investors.
Conclusion:
Based on the analysis of the technical indicators, the stock price of VTHR is likely to experience a short-term consolidation or pullback. While the trend and momentum indicators signal a bullish sentiment, the volatility and volume indicators suggest a potential pause in the upward movement. Traders should exercise caution and consider waiting for clearer signals before making significant trading decisions.