Technical Analysis of VTIP 2024-05-10
Overview:
In analyzing the technical indicators for VTIP over the last 5 days, we will delve into the trend, momentum, volatility, and volume indicators to provide a comprehensive outlook on the possible stock price movement in the coming days. By examining these key indicators, we aim to offer valuable insights and predictions for informed decision-making.
Trend Analysis:
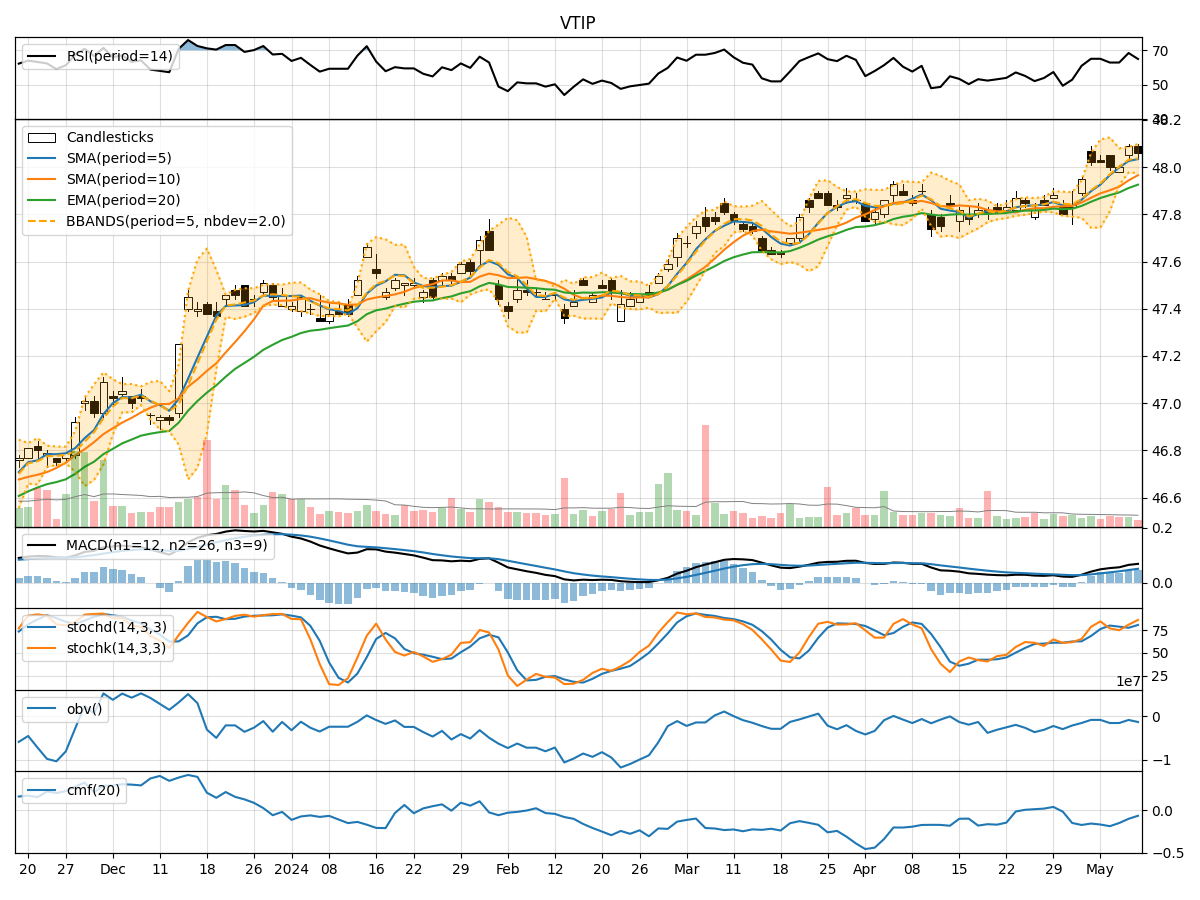
- Moving Averages (MA): The 5-day MA has been consistently above the 10-day SMA and 20-day EMA, indicating a short-term uptrend.
- MACD: The MACD line has been trending upwards, staying above the signal line, suggesting bullish momentum.
- RSI: The RSI has been fluctuating in the overbought territory, indicating strong buying pressure.
Key Observation: The trend indicators suggest a bullish sentiment in the short term.
Momentum Analysis:
- Stochastic Oscillator: Both %K and %D have been in the overbought zone, signaling potential overvaluation.
- Williams %R: The indicator has been hovering in the oversold region, indicating a possible reversal.
Key Observation: Momentum indicators show conflicting signals, with stochastic oscillator suggesting overbought conditions and Williams %R hinting at a potential reversal.
Volatility Analysis:
- Bollinger Bands (BB): The stock price has been trading within the bands, with the %B indicator fluctuating around the midline.
- Average True Range (ATR): ATR values have been relatively stable, indicating consistent price movements.
Key Observation: Volatility indicators suggest a period of consolidation with no significant price breakout.
Volume Analysis:
- On-Balance Volume (OBV): The OBV has been relatively flat, indicating a balance between buying and selling pressure.
- Chaikin Money Flow (CMF): The CMF has been negative, suggesting outflow of money from the stock.
Key Observation: Volume indicators reflect a lack of strong buying or selling pressure in the recent trading days.
Conclusion:
Based on the analysis of trend, momentum, volatility, and volume indicators, the next few days for VTIP are likely to see sideways movement with a potential for a slight pullback. The bullish sentiment from trend indicators may be offset by the conflicting signals from momentum indicators, leading to a period of consolidation. Volatility is expected to remain low, indicating a lack of significant price movements. Traders should exercise caution and wait for clearer signals before making significant trading decisions.
Key Conclusion:
- Overall View: Sideways movement with a slight bearish bias.
- Immediate Action: Wait for clearer signals before entering new positions.
- Risk Management: Implement tight stop-loss strategies to mitigate potential losses.
By considering the interplay of various technical indicators, traders can navigate the market dynamics effectively and make well-informed decisions.