Technical Analysis of VTWO 2024-05-10
Overview:
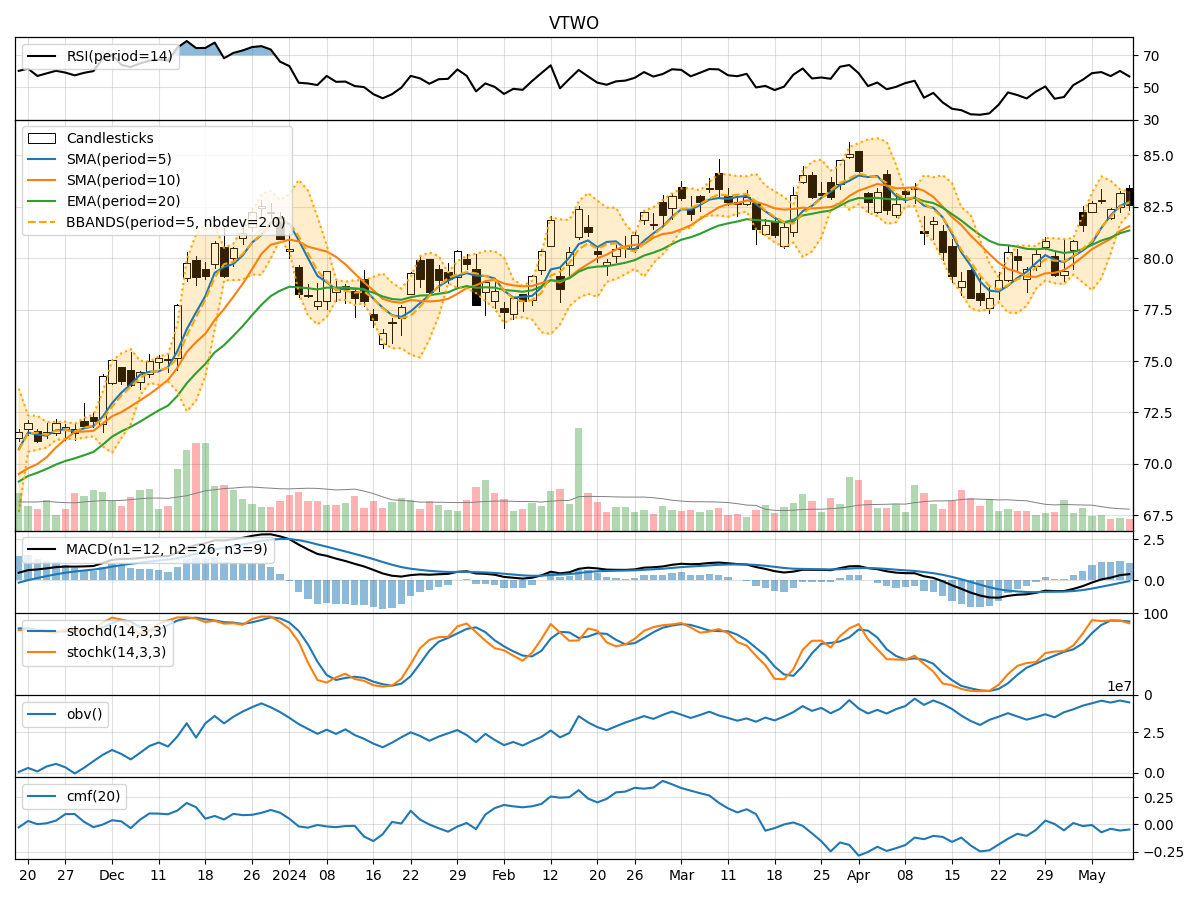
In analyzing the technical indicators for VTWO over the last 5 days, we will delve into the trend, momentum, volatility, and volume indicators to provide a comprehensive outlook on the possible stock price movement in the coming days. By examining these key aspects, we aim to offer valuable insights and predictions for investors looking to make informed decisions.
Trend Analysis:
- Moving Averages (MA): The 5-day MA has been consistently above the 10-day SMA, indicating a short-term bullish trend.
- MACD: The MACD line has been positive and increasing, suggesting upward momentum.
- RSI: The RSI has been fluctuating around the 50 level, indicating a neutral stance in terms of momentum.
Momentum Analysis:
- Stochastic Oscillator: The Stochastic indicators have been in overbought territory, signaling a potential reversal or consolidation.
- Williams %R (WillR): The WillR has been in oversold territory, indicating a possible buying opportunity.
Volatility Analysis:
- Bollinger Bands (BB): The price has been trading within the Bollinger Bands, with the bands narrowing, suggesting reduced volatility.
- BB %B: The %B indicator has been hovering around the middle range, indicating a balanced market sentiment.
Volume Analysis:
- On-Balance Volume (OBV): The OBV has been relatively stable, suggesting a neutral volume flow.
- Chaikin Money Flow (CMF): The CMF has been negative, indicating some distribution in the stock.
Conclusion:
Based on the analysis of the technical indicators, the next few days for VTWO could see sideways movement with a slight bias towards consolidation. The trend indicators suggest a short-term bullish bias, supported by the positive MACD and MA crossover. However, the momentum indicators, particularly the Stochastic Oscillator, hint at a potential reversal or consolidation due to overbought conditions. Volatility remains relatively low, indicating a stable price range in the near term.
Investors should monitor the Stochastic indicators closely for any signs of a reversal, as well as keep an eye on the OBV for any significant shifts in volume sentiment. Overall, a cautious approach with a focus on risk management is advisable in the current market environment.
Key Takeaways:
- Trend: Short-term bullish bias.
- Momentum: Potential for reversal or consolidation.
- Volatility: Low volatility, stable price range.
- Volume: Neutral volume flow, some distribution observed.
Recommendation:
Exercise caution and consider implementing risk management strategies in trading decisions. Stay vigilant for any signs of a trend reversal or increased volatility that could impact price movements.