Technical Analysis of VUSB 2024-05-10
Overview:
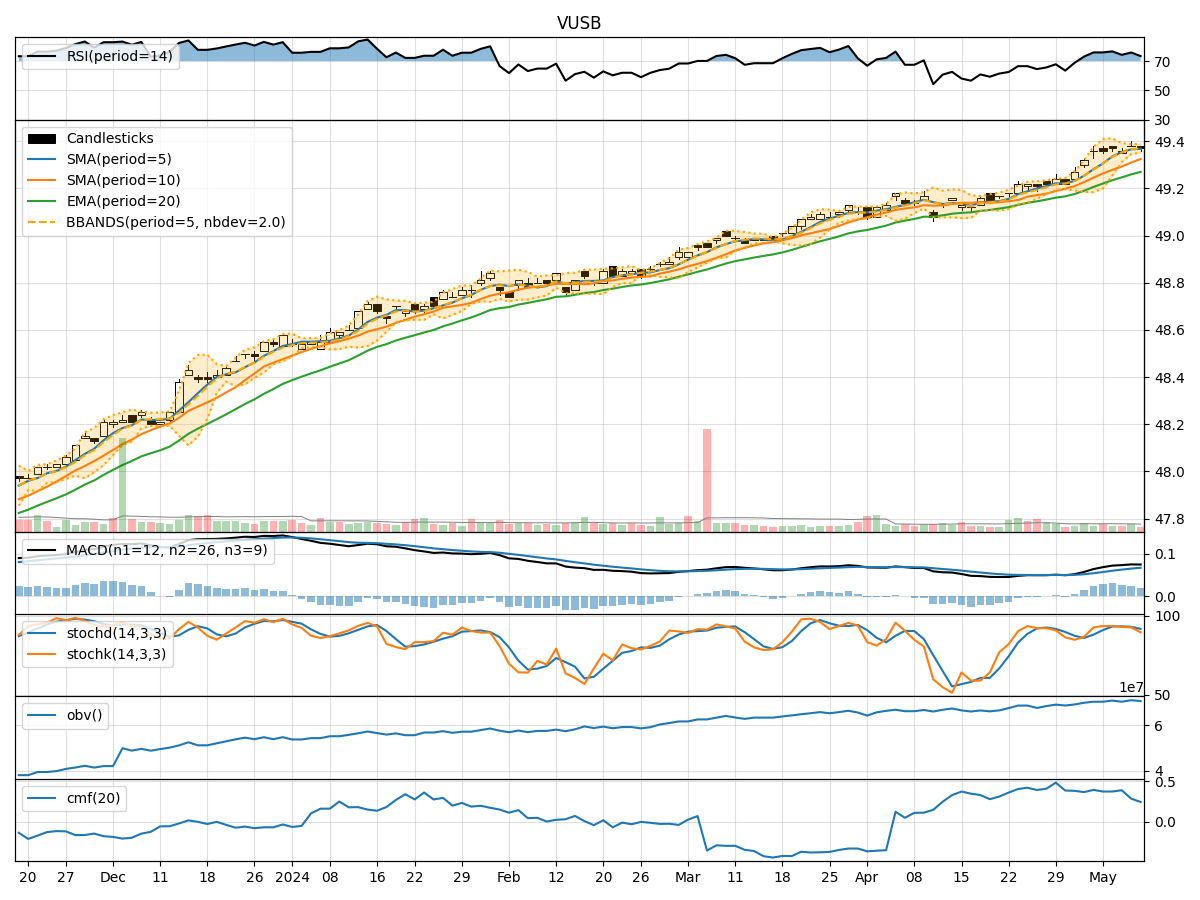
In analyzing the technical indicators for VUSB over the last 5 days, we will delve into the trend, momentum, volatility, and volume indicators to provide a comprehensive outlook on the possible stock price movement in the coming days.
Trend Analysis:
- Moving Averages (MA): The 5-day MA has been consistently above the closing price, indicating a short-term uptrend.
- MACD: The MACD line has been positive, suggesting bullish momentum.
- RSI: The RSI has been in the overbought territory, reflecting strong buying pressure.
Key Observation: The trend indicators point towards a bullish sentiment in the stock.
Momentum Analysis:
- Stochastic Oscillator: Both %K and %D have been relatively high, indicating strong upward momentum.
- Williams %R: The indicator has been in the oversold region, suggesting a potential reversal.
Key Observation: Momentum indicators signal a bullish momentum in the stock.
Volatility Analysis:
- Bollinger Bands (BB): The bands have been relatively narrow, indicating low volatility.
- BB %B: The %B has been fluctuating around the midline, suggesting a lack of strong trend.
Key Observation: Volatility indicators suggest a sideways movement in the stock.
Volume Analysis:
- On-Balance Volume (OBV): The OBV has shown mixed movements, indicating indecision among investors.
- Chaikin Money Flow (CMF): The CMF has been positive but declining, signaling weakening buying pressure.
Key Observation: Volume indicators reflect a neutral stance in the stock.
Conclusion:
Based on the analysis of trend, momentum, volatility, and volume indicators, the overall outlook for VUSB in the next few days leans towards a bullish sentiment. The trend and momentum indicators suggest continued upward movement, while volatility indicates a sideways trend. However, the mixed signals from volume indicators imply a degree of uncertainty in the market sentiment.
Therefore, the next few days may see VUSB experiencing a mix of bullish momentum with some consolidation or sideways movement. Investors should closely monitor key support and resistance levels for potential entry or exit points.