Technical Analysis of VUSE 2024-05-10
Overview:
In analyzing the technical indicators for VUSE stock over the last 5 days, we will delve into the trend, momentum, volatility, and volume indicators to provide a comprehensive outlook on the possible future stock price movement. By examining these key aspects, we aim to offer valuable insights and predictions for the upcoming trading days.
Trend Analysis:
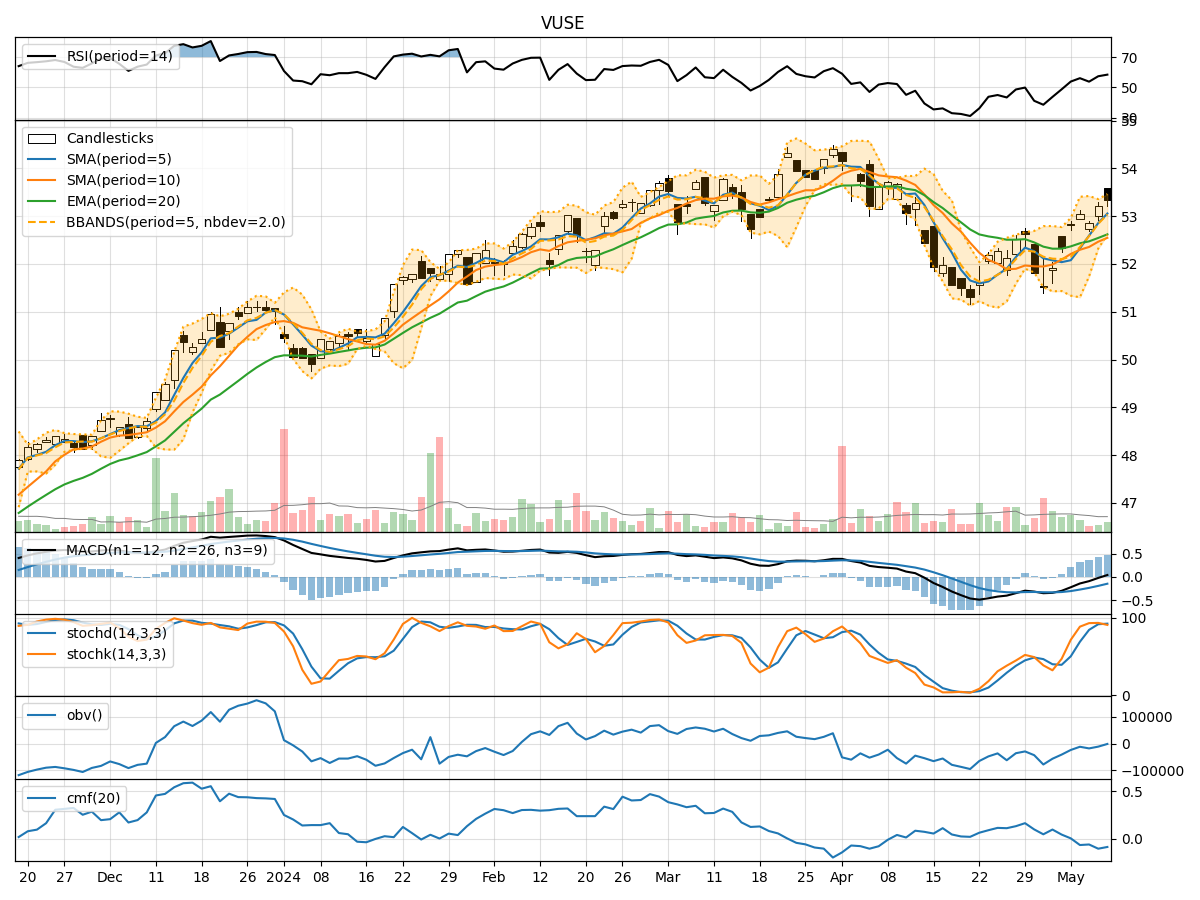
- Moving Averages (MA): The 5-day Moving Average (MA) has been consistently above the Simple Moving Average (SMA) and Exponential Moving Average (EMA), indicating a bullish trend.
- MACD: The MACD line has been above the signal line, with both lines showing an upward trend, suggesting bullish momentum.
- MACD Histogram: The MACD Histogram has been increasing, indicating strengthening bullish momentum.
Momentum Analysis:
- RSI: The Relative Strength Index (RSI) has been in the overbought territory, suggesting a strong bullish momentum.
- Stochastic Oscillator: Both %K and %D lines of the Stochastic Oscillator have been in the overbought zone, indicating a potential reversal or consolidation.
- Williams %R: The Williams %R has been in the oversold region, signaling a potential reversal to the upside.
Volatility Analysis:
- Bollinger Bands: The stock price has been trading within the Bollinger Bands, with the bands narrowing, indicating decreasing volatility.
- Bollinger %B: The %B indicator has been hovering around 0.8-0.9, suggesting the stock is trading near the upper band.
Volume Analysis:
- On-Balance Volume (OBV): The OBV has shown mixed signals, with fluctuations in volume accumulation.
- Chaikin Money Flow (CMF): The CMF has been negative, indicating selling pressure in the stock.
Key Observations:
- The trend indicators suggest a strong bullish sentiment in the short term.
- Momentum indicators point towards a potential overbought scenario, signaling a need for caution.
- Volatility has been decreasing, indicating a possible period of consolidation.
- Volume indicators show mixed signals, with no clear trend in volume accumulation.
Conclusion:
Based on the analysis of the technical indicators, the next few days for VUSE stock are likely to see continued upward movement in the stock price, driven by the bullish trend and momentum. However, caution is advised due to the overbought signals from the momentum indicators. The decreasing volatility may lead to a period of consolidation before any further significant price movements. Keep a close eye on volume dynamics for confirmation of the bullish trend.