Technical Analysis of VWI 2024-05-10
Overview:
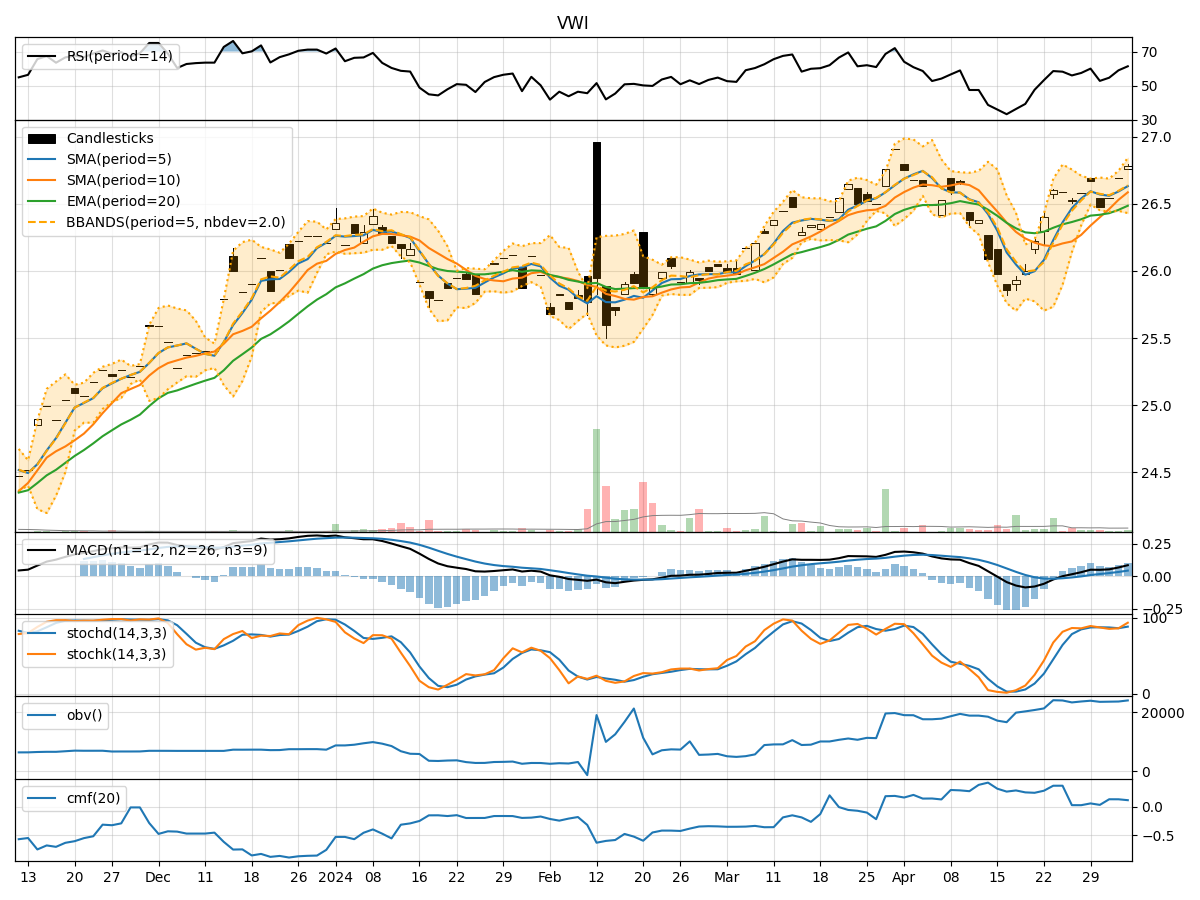
In analyzing the provided VWI TA data for the last 5 days, we will delve into the technical indicators across trend, momentum, volatility, and volume to derive insights into the possible future stock price movement. By examining key metrics and patterns, we aim to provide a comprehensive outlook on the stock's potential trajectory.
Trend Analysis:
- Moving Averages (MA): The 5-day MA has been consistently above the 10-day SMA, indicating a short-term bullish trend.
- MACD: The MACD line has been steadily increasing, with the MACD line above the signal line, suggesting bullish momentum.
- RSI: The RSI values have been trending upwards, indicating increasing buying pressure.
Momentum Analysis:
- Stochastic Oscillator: Both %K and %D values have been relatively high, signaling overbought conditions.
- Williams %R: The Williams %R values have been hovering around 0, indicating a potential reversal from overbought levels.
Volatility Analysis:
- Bollinger Bands (BB): The stock price has been trading within the upper Bollinger Band, suggesting an overbought condition.
- BB Width: The BB Width has been narrowing, indicating decreasing volatility.
Volume Analysis:
- On-Balance Volume (OBV): The OBV has been showing a slight increase, suggesting accumulation by investors.
- Chaikin Money Flow (CMF): The CMF has been positive, indicating buying pressure in the stock.
Key Observations:
- The stock is currently in an upward trend based on moving averages and MACD.
- Momentum indicators suggest the stock is overbought and may experience a pullback.
- Volatility has been decreasing, indicating a potential period of consolidation.
- Volume indicators show positive accumulation and buying pressure.
Conclusion:
Based on the analysis of the technical indicators, the next few days may see the stock price experiencing a short-term pullback due to overbought conditions highlighted by momentum indicators. However, the overall trend remains bullish supported by moving averages and positive volume indicators. Traders should be cautious of potential profit-taking and monitor for a possible entry point during the pullback phase.