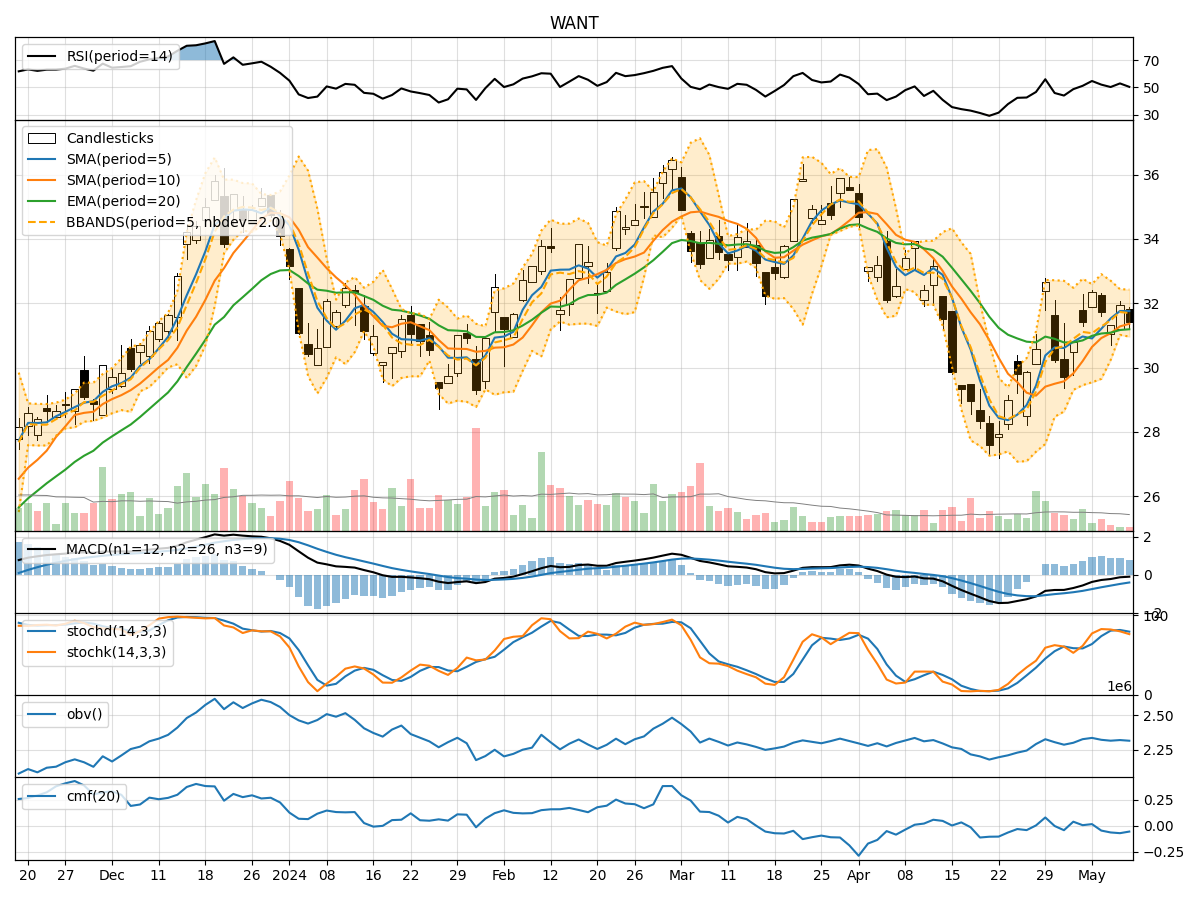
Technical Analysis of WANT 2024-05-10
Overview:
In analyzing the technical indicators for the stock over the last 5 days, we will delve into the trends, momentum, volatility, and volume aspects to provide a comprehensive outlook on the possible stock price movement in the coming days. By examining key indicators such as moving averages, MACD, RSI, Bollinger Bands, and OBV, we aim to offer valuable insights and predictions for informed decision-making.
Trend Analysis:
- Moving Averages (MA): The 5-day moving average has been consistently above the 10-day simple moving average, indicating a short-term bullish trend.
- MACD: The MACD line has been negative but converging towards the signal line, suggesting a potential reversal in the bearish momentum.
- EMA: The exponential moving average has been trending slightly upwards, reflecting a gradual positive momentum.
Momentum Analysis:
- RSI: The Relative Strength Index has been fluctuating around the neutral 50 level, indicating indecision in the market.
- Stochastic Oscillator: Both %K and %D have been declining, signaling a potential bearish momentum.
- Williams %R: The Williams %R is in oversold territory, suggesting a possible reversal to the upside.
Volatility Analysis:
- Bollinger Bands: The stock price has been trading within the Bollinger Bands, with the bands narrowing, indicating reduced volatility.
- Bollinger Band %B: The %B indicator is currently below 0.5, suggesting a potential buying opportunity as the stock may be oversold.
Volume Analysis:
- On-Balance Volume (OBV): The OBV has been fluctuating but showing a slight decline, indicating some distribution happening in the stock.
- Chaikin Money Flow (CMF): The CMF has been negative, reflecting selling pressure in the stock.
Conclusion:
Based on the analysis of the technical indicators, the stock is currently exhibiting mixed signals. The trend indicators suggest a potential bullish reversal in the short term, supported by the positive EMA trend. However, the momentum indicators are more bearish, with the RSI hovering around neutrality and the stochastic oscillator showing a bearish bias.
The volatility analysis indicates a period of reduced volatility, which could precede a significant price movement. The volume indicators suggest some distribution in the stock, as reflected by the declining OBV and negative CMF.
Overall Assessment:
- Short-Term Outlook: The stock may experience some consolidation in the near term, with a potential for a bullish reversal based on the trend indicators.
- Medium- to Long-Term Outlook: The bearish momentum indicated by the momentum indicators could lead to further downside pressure if not reversed soon.
Recommendation:
- Caution: Exercise caution in trading this stock in the short term due to conflicting signals.
- Monitor: Keep a close eye on the MACD for a potential bullish crossover as a signal for a trend reversal.
- Wait for Confirmation: Wait for confirmation from both momentum and volume indicators before making significant trading decisions.
Key Conclusion:
The stock is currently in a consolidation phase with a slight bullish bias in the short term but a cautious outlook for medium- to long-term trading.