Technical Analysis of WBIG 2024-05-10
Overview:
In analyzing the technical indicators for WBIG stock over the last 5 days, we will delve into the trends, momentum, volatility, and volume indicators to provide a comprehensive outlook on the possible future stock price movement. By examining these key indicators, we aim to offer valuable insights and predictions for the upcoming trading days.
Trend Analysis:
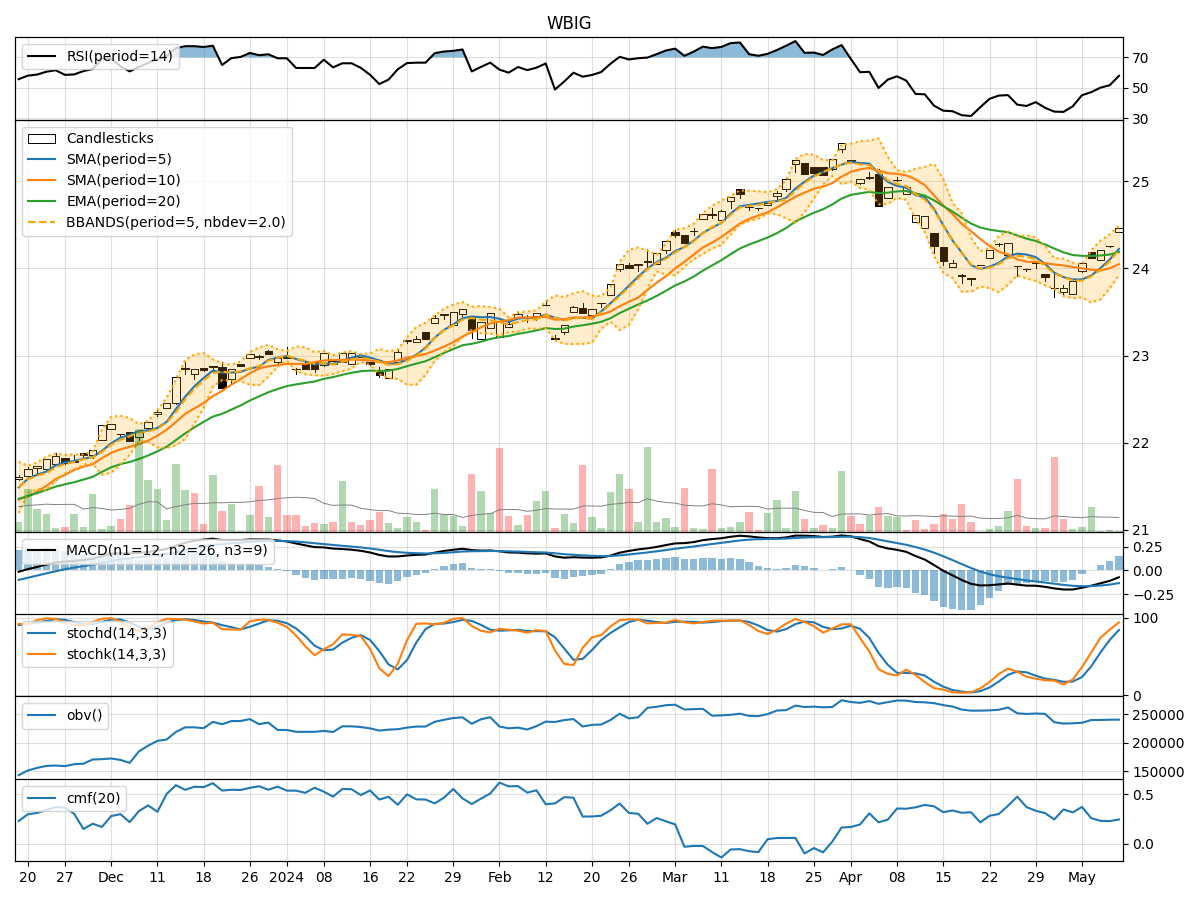
- Moving Averages (MA): The 5-day Moving Average (MA) has been showing an upward trend, indicating a positive momentum in the stock price.
- MACD: The Moving Average Convergence Divergence (MACD) has been consistently negative but showing signs of convergence towards the signal line, suggesting a potential reversal in the short term.
- RSI: The Relative Strength Index (RSI) has been gradually increasing, indicating strengthening bullish momentum in the stock.
Momentum Analysis:
- Stochastic Oscillator: Both %K and %D values of the Stochastic Oscillator have been rising, signaling increasing buying pressure and potential upward movement in the stock price.
- Williams %R: The Williams %R indicator has been moving towards the oversold territory, suggesting a possible buying opportunity in the near future.
Volatility Analysis:
- Bollinger Bands: The Bollinger Bands have been widening, indicating increased volatility in the stock price. The upper band has been expanding, potentially signaling a bullish breakout.
- Average True Range (ATR): The ATR has been rising, reflecting an increase in price volatility and potential larger price movements.
Volume Analysis:
- On-Balance Volume (OBV): The OBV indicator has been steadily increasing, indicating strong buying interest in the stock.
- Chaikin Money Flow (CMF): The CMF has been positive, suggesting that money is flowing into the stock, supporting the bullish sentiment.
Conclusion:
Based on the analysis of the technical indicators, the overall outlook for WBIG stock in the next few days appears bullish. The positive trends in moving averages, improving momentum indicators, increasing buying pressure, expanding Bollinger Bands, rising OBV, and positive CMF all point towards a potential upward movement in the stock price. Traders and investors may consider taking long positions or holding onto existing positions to capitalize on the expected bullish trend.
Key Takeaways:
- Upward Trend: The stock is likely to continue its upward trajectory.
- Bullish Momentum: Increasing buying pressure and positive momentum indicators support a bullish view.
- Volatility: Expect heightened volatility, potentially leading to larger price swings.
- Volume: Strong buying interest and positive money flow indicate investor confidence in the stock.
In conclusion, the technical analysis suggests a favorable outlook for WBIG stock, with a high probability of upward price movement in the coming days. Investors should monitor the indicators closely for any signs of reversal or trend continuation.