Technical Analysis of WBIL 2024-05-10
Overview:
In analyzing the technical indicators for WBIL over the last 5 days, we will delve into the trend, momentum, volatility, and volume indicators to provide a comprehensive outlook on the possible stock price movement in the coming days. By examining these key indicators, we aim to offer valuable insights and predictions for potential investors.
Trend Indicators:
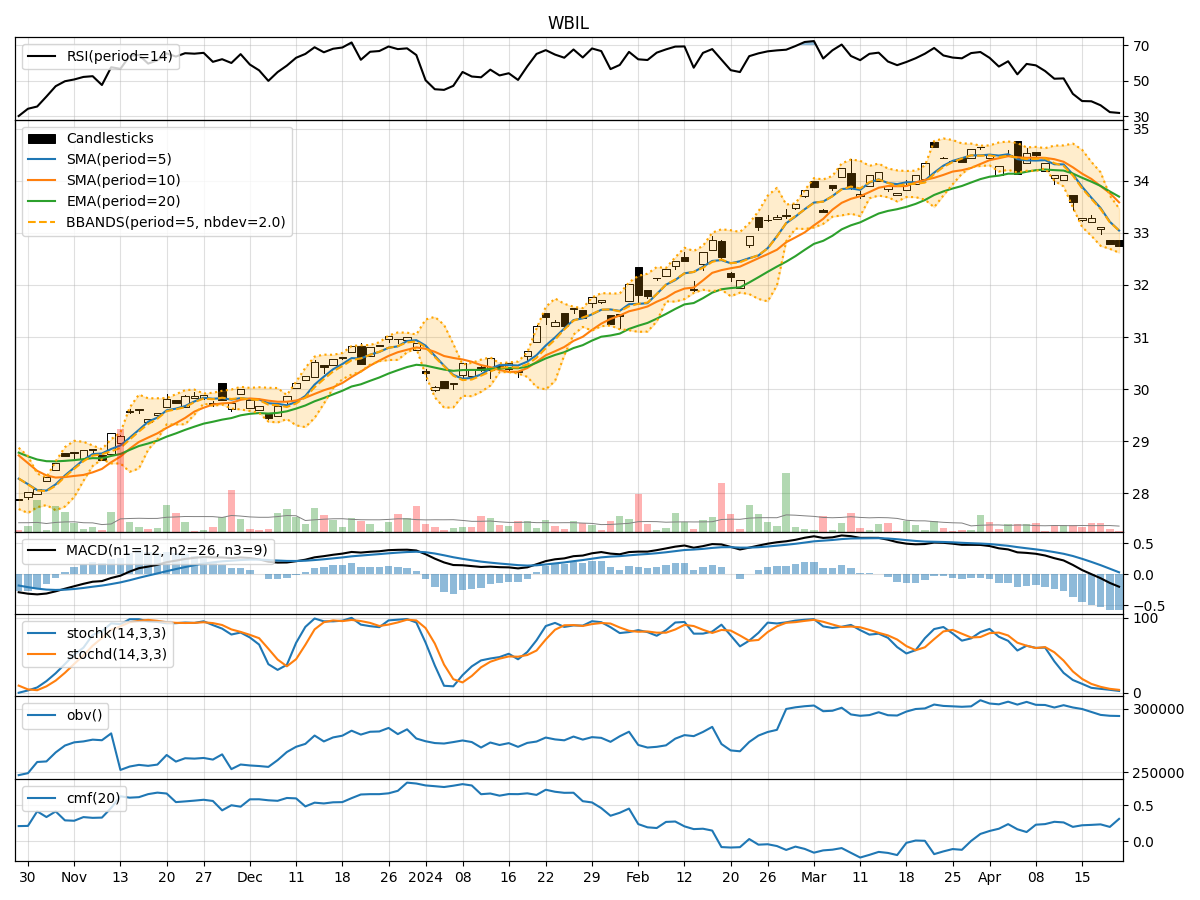
- Moving Averages (MA): The 5-day MA has been consistently above the closing prices, indicating a short-term uptrend.
- MACD: The MACD line has been negative but showing signs of convergence towards the signal line, suggesting a potential reversal.
- RSI: The RSI has been gradually increasing, reflecting strengthening bullish momentum.
Momentum Indicators:
- Stochastic Oscillator: Both %K and %D have been in overbought territory, signaling a potential reversal or consolidation.
- Williams %R: The indicator has been consistently at or near oversold levels, indicating a possible buying opportunity.
Volatility Indicators:
- Bollinger Bands (BB): The bands have been narrowing, suggesting decreasing volatility and a potential breakout.
- BB %B: The %B indicator has been fluctuating within a range, indicating indecision in the market.
Volume Indicators:
- On-Balance Volume (OBV): The OBV has been steadily increasing, indicating accumulation by investors.
- Chaikin Money Flow (CMF): The CMF has been positive, reflecting buying pressure in the stock.
Key Observations:
- The trend indicators suggest a potential reversal or continuation of the uptrend.
- Momentum indicators indicate a mixed signal with overbought conditions.
- Volatility indicators point towards a potential breakout or consolidation phase.
- Volume indicators show accumulation and positive buying pressure.
Conclusion:
Based on the analysis of the technical indicators, the next few days' possible stock price movement for WBIL is likely to experience a consolidation phase. The stock may trade within a range as it digests recent gains and awaits further catalysts. Investors should monitor key support and resistance levels for potential breakout opportunities. Overall, the outlook is neutral with a slight bias towards consolidation.