Technical Analysis of WBIY 2024-05-10
Overview:
In analyzing the technical indicators for WBIY over the last 5 days, we will delve into the trend, momentum, volatility, and volume indicators to provide a comprehensive outlook on the possible stock price movement in the coming days. By examining these key indicators, we aim to offer valuable insights and predictions for potential investors.
Trend Analysis:
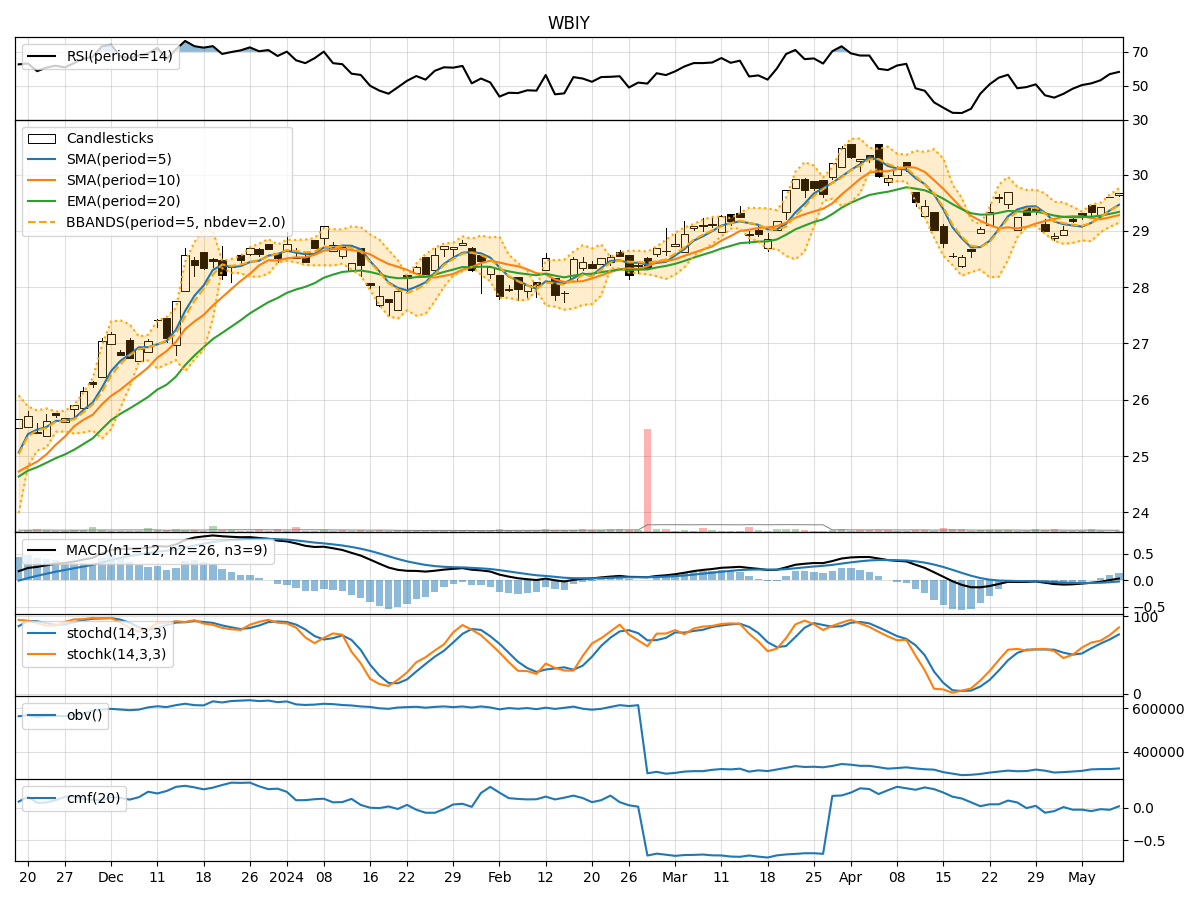
- Moving Averages (MA): The 5-day Moving Average (MA) has been consistently above the Simple Moving Average (SMA) and Exponential Moving Average (EMA), indicating a short-term bullish trend.
- MACD: The MACD line has been above the signal line, with the MACD Histogram showing an increasing positive trend, suggesting bullish momentum.
Momentum Analysis:
- RSI: The Relative Strength Index (RSI) has been gradually increasing and is currently in the neutral zone, indicating potential room for further upside movement.
- Stochastic Oscillator: Both %K and %D lines of the Stochastic Oscillator are in the overbought territory, suggesting a potential reversal or consolidation.
Volatility Analysis:
- Bollinger Bands (BB): The stock price has been trading within the upper Bollinger Band (BBU), indicating an overbought condition. However, the bands are not significantly widening, suggesting a possible consolidation phase.
- Bollinger %B (BBP): The %B indicator is below 1, indicating that the price is trading above the upper band, signaling a potential pullback or consolidation.
Volume Analysis:
- On-Balance Volume (OBV): The OBV has been showing a slight decrease, indicating some distribution happening in the stock.
- Chaikin Money Flow (CMF): The CMF is negative, suggesting that money is flowing out of the stock, which could lead to downward pressure on the price.
Conclusion:
Based on the analysis of the technical indicators, the stock of WBIY is currently exhibiting signs of being overbought in the short term, as indicated by the high RSI and Stochastic levels. The Bollinger Bands also suggest a potential pullback or consolidation phase in the near future. Additionally, the negative CMF and decreasing OBV signal a weakening buying pressure.
Overall Assessment:
- Short-Term Outlook: The stock may experience a pullback or consolidation in the next few days due to overbought conditions and weakening buying pressure.
- Long-Term View: While the short-term outlook is cautious, the long-term trend remains bullish based on the moving averages and MACD analysis.
Recommendation:
- Short-Term Traders: Consider taking profits or setting stop-loss orders to protect gains during a potential pullback.
- Long-Term Investors: Hold onto positions, as the long-term trend remains positive, but monitor the stock closely for any signs of a trend reversal.
By carefully considering the technical indicators and their implications, investors can make informed decisions aligned with the current market dynamics and potential price movements of WBIY stock.