Technical Analysis of WCBR 2024-05-10
Overview:
In analyzing the technical indicators for WCBR stock over the last 5 days, we will delve into the trend, momentum, volatility, and volume indicators to provide a comprehensive outlook on the possible future stock price movement. By examining these key indicators, we aim to offer valuable insights and predictions for the upcoming trading days.
Trend Indicators:
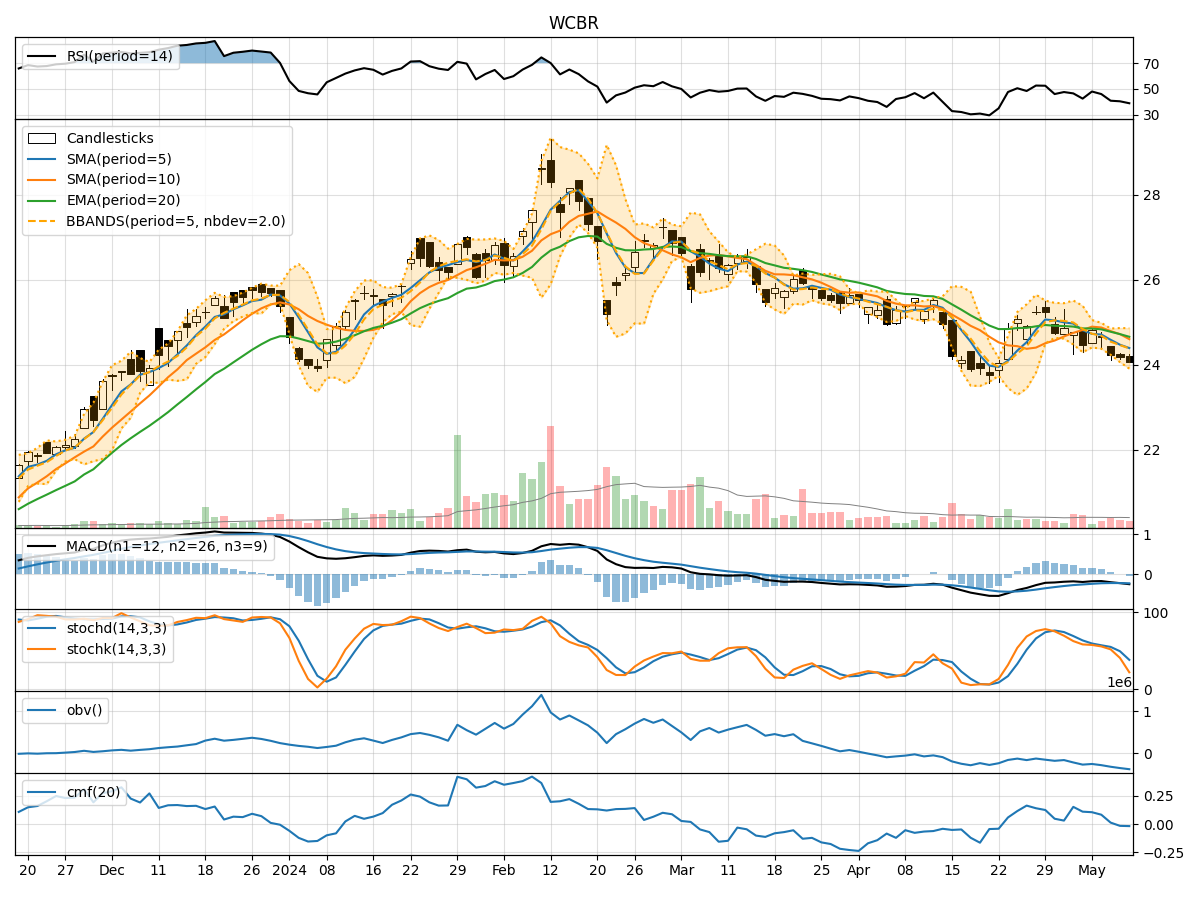
- Moving Averages (MA): The 5-day Moving Average (MA) has been gradually decreasing, indicating a short-term bearish trend.
- MACD and Signal Line: The MACD line has been consistently below the Signal Line, suggesting a bearish momentum in the stock.
- Relative Strength Index (RSI): The RSI has been declining and is currently below 50, indicating a weakening momentum.
Momentum Indicators:
- Stochastic Oscillator: Both %K and %D values have been decreasing, with %K reaching oversold levels, signaling a potential reversal or continuation of the downtrend.
- Williams %R (WillR): The Williams %R is in the oversold territory, indicating a possible buying opportunity or a reversal in the stock price.
Volatility Indicators:
- Bollinger Bands (BB): The stock price has been trading below the lower Bollinger Band, suggesting an oversold condition. This could indicate a potential bounce back or reversal in the price.
- Bollinger Band Width (BBW): The Bollinger Band Width has been widening, indicating increased volatility in the stock.
Volume Indicators:
- On-Balance Volume (OBV): The OBV has been declining, indicating selling pressure in the stock.
- Chaikin Money Flow (CMF): The CMF has been negative, suggesting that money is flowing out of the stock.
Key Observations and Opinions:
- The trend indicators, momentum indicators, and volume indicators all point towards a bearish sentiment in the stock.
- The oversold conditions indicated by the Stochastic Oscillator and Williams %R could potentially lead to a short-term reversal or bounce back in the stock price.
- The widening Bollinger Band Width suggests increased volatility, which could lead to sharp price movements in either direction.
Conclusion:
Based on the analysis of the technical indicators, the outlook for WCBR stock in the next few days is bearish. However, the oversold conditions and increased volatility could present trading opportunities for short-term gains. Traders should closely monitor key support and resistance levels, as well as watch for any signs of a potential reversal in the stock price.