Technical Analysis of WCEO 2024-05-10
Overview:
In analyzing the technical indicators for WCEO over the last 5 days, we will delve into the trends, momentum, volatility, and volume aspects to provide a comprehensive outlook on the possible stock price movement in the coming days.
Trend Analysis:
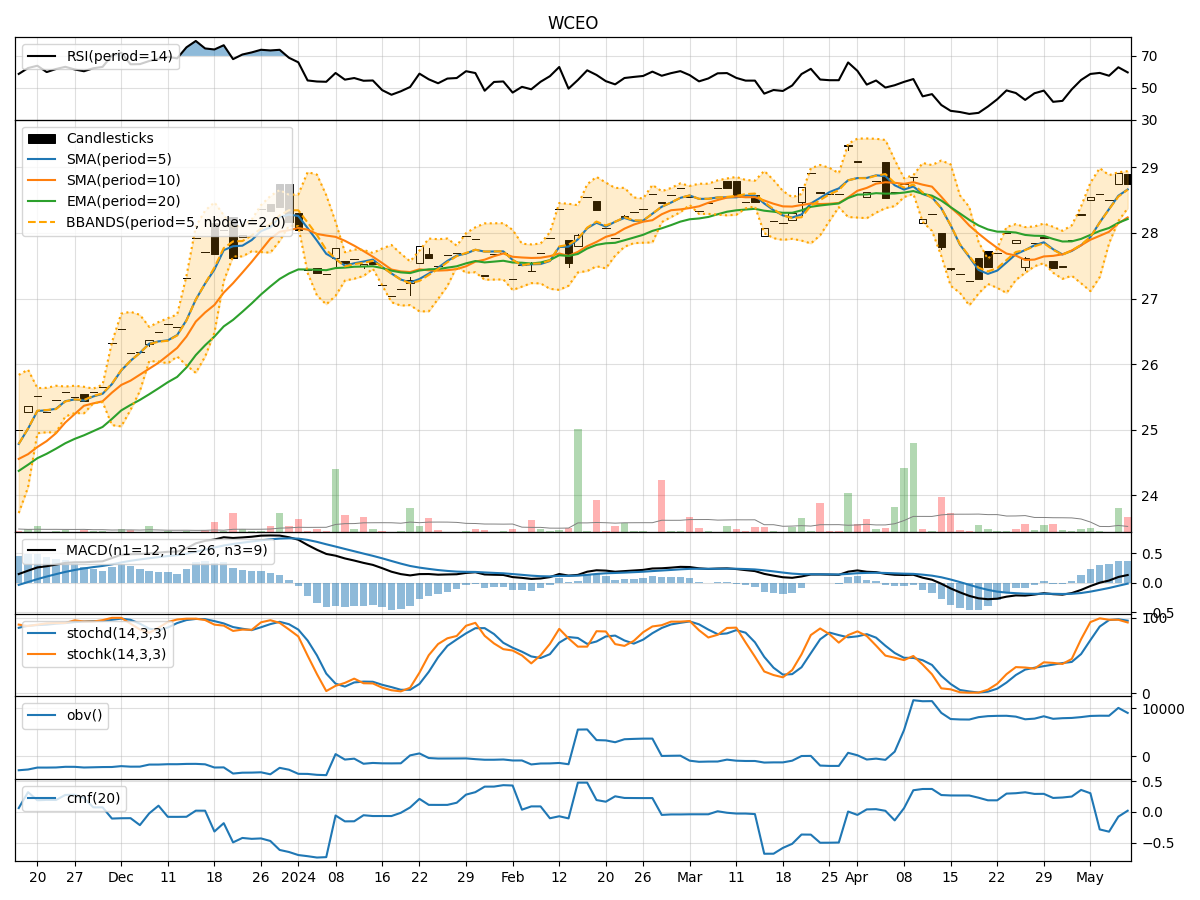
- Moving Averages (MA): The 5-day Moving Average has been consistently above the Simple Moving Average (SMA) and Exponential Moving Average (EMA), indicating a bullish trend.
- MACD: The MACD line has been consistently above the signal line, with the MACD Histogram showing an increasing positive value, suggesting a strengthening bullish momentum.
Momentum Analysis:
- RSI: The Relative Strength Index (RSI) has been fluctuating around the 60-70 range, indicating a neutral to slightly bullish momentum.
- Stochastic Oscillator: Both %K and %D have been in the overbought zone, suggesting a potential reversal or consolidation phase.
- Williams %R: The Williams %R has been hovering in the oversold territory, indicating a potential buying opportunity.
Volatility Analysis:
- Bollinger Bands (BB): The stock price has been trading within the Bollinger Bands, with the bands narrowing, suggesting a period of low volatility.
- Bollinger %B: The %B indicator has been fluctuating around 0.6-0.9, indicating a moderate to high price level relative to the bands.
Volume Analysis:
- On-Balance Volume (OBV): The OBV has shown mixed signals, with some days seeing positive volume accumulation and others showing distribution.
- Chaikin Money Flow (CMF): The CMF has been negative, indicating selling pressure in the stock.
Key Observations:
- The trend indicators suggest a strong bullish sentiment in the short term.
- Momentum indicators show a mixed picture with potential signs of overbought conditions.
- Volatility indicators point towards a period of low volatility and potential consolidation.
- Volume indicators reflect a lack of strong buying interest and some selling pressure.
Conclusion:
Based on the analysis of the technical indicators, the stock price of WCEO is likely to experience sideways movement or consolidation in the coming days. The bullish trend may face resistance due to overbought conditions in momentum indicators and lack of significant buying volume. Traders should exercise caution and consider waiting for clearer signals before making any significant trading decisions.