Technical Analysis of WDIV 2024-05-10
Overview:
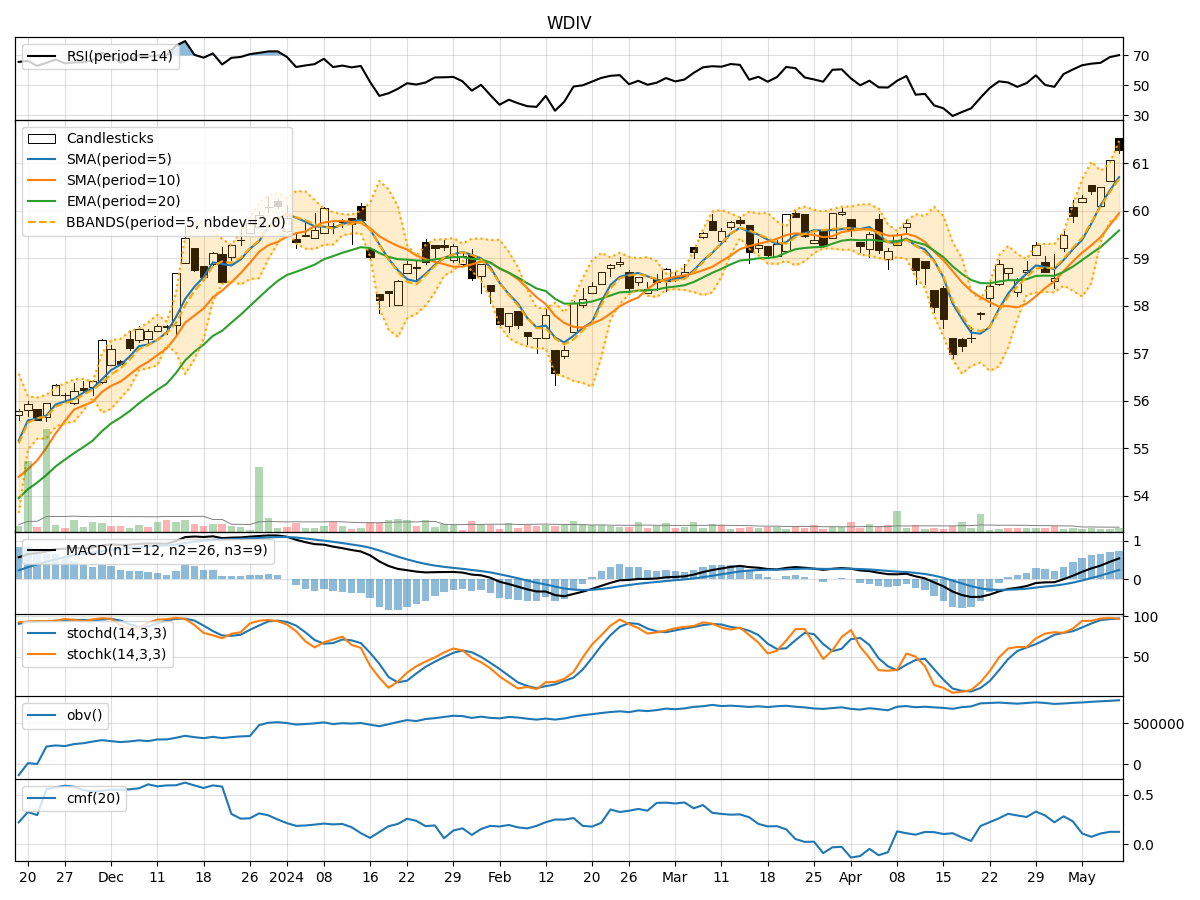
In analyzing the technical indicators for WDIV over the last 5 days, we will delve into the trend, momentum, volatility, and volume indicators to provide a comprehensive outlook on the possible stock price movement in the coming days.
Trend Analysis:
- Moving Averages (MA): The 5-day Moving Average has been consistently above the Simple Moving Average (SMA) and Exponential Moving Average (EMA), indicating a bullish trend.
- MACD: The MACD line has been above the signal line, with both lines showing an upward trend, suggesting bullish momentum.
Momentum Analysis:
- RSI: The Relative Strength Index (RSI) has been increasing and is currently in the overbought territory, indicating a strong bullish momentum.
- Stochastic Oscillator: Both %K and %D lines are in the overbought zone, suggesting a potential reversal or consolidation.
Volatility Analysis:
- Bollinger Bands (BB): The stock price has been consistently trading above the middle Bollinger Band, indicating an upward trend with moderate volatility.
Volume Analysis:
- On-Balance Volume (OBV): The OBV has been steadily increasing, reflecting strong buying pressure.
- Chaikin Money Flow (CMF): The CMF has been positive, indicating that money is flowing into the stock.
Key Observations:
- The trend indicators suggest a strong bullish sentiment with moving averages and MACD supporting an upward trend.
- Momentum indicators like RSI and Stochastic Oscillator indicate overbought conditions, signaling a potential reversal or consolidation.
- Volatility remains moderate, as indicated by the Bollinger Bands, supporting a steady uptrend.
- Volume indicators show increasing buying pressure with OBV and positive money flow with CMF.
Conclusion:
Based on the analysis of the technical indicators, the stock price of WDIV is likely to experience a short-term consolidation or a minor pullback due to the overbought conditions highlighted by the momentum indicators. However, the overall trend remains bullish, supported by the moving averages and MACD. Traders should be cautious of a potential reversal in the short term but maintain a bullish outlook for the stock in the longer run.