Technical Analysis of WEAT 2024-05-10
Overview:
In analyzing the technical indicators for WEAT over the last 5 days, we will delve into the trend, momentum, volatility, and volume indicators to provide a comprehensive outlook on the possible stock price movement in the coming days. By examining these key aspects, we aim to offer valuable insights and predictions to guide investment decisions.
Trend Analysis:
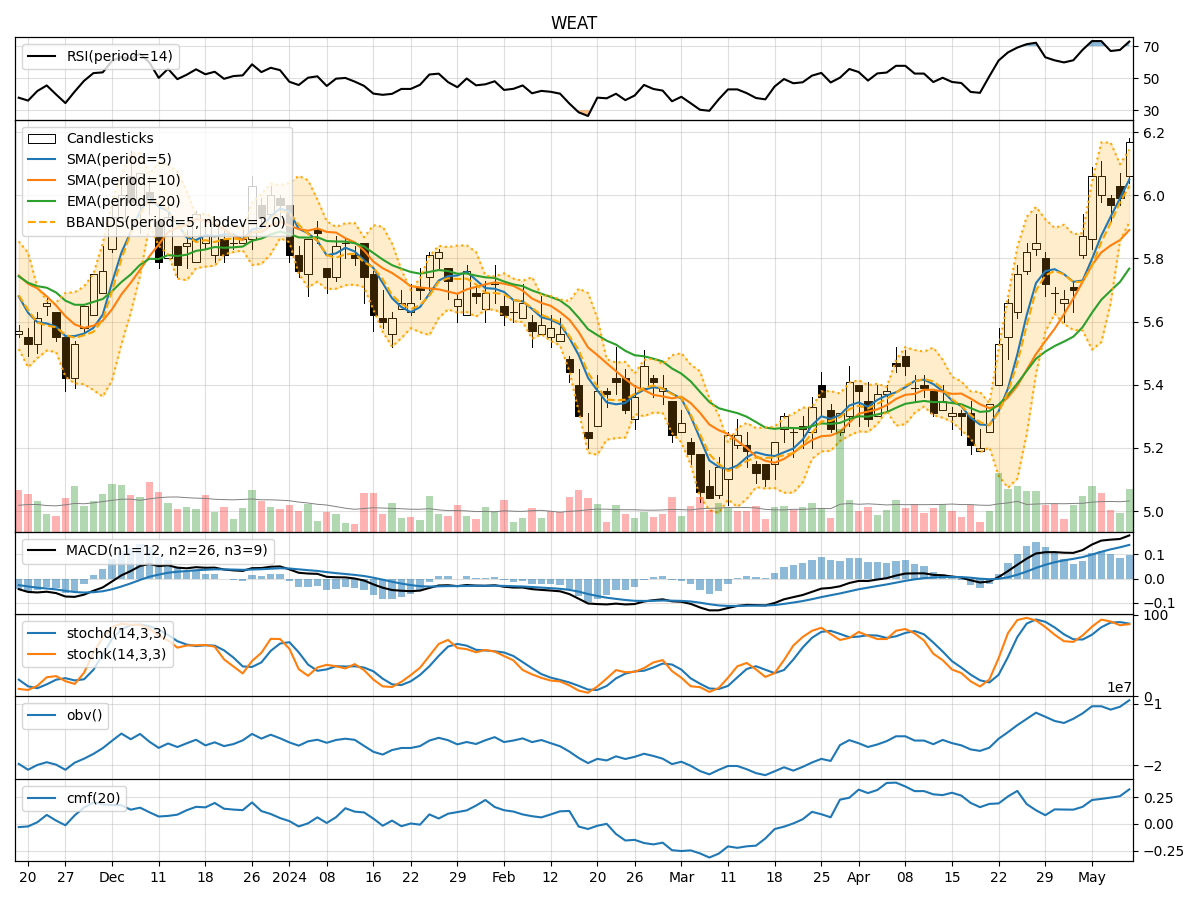
- Moving Averages (MA): The 5-day Moving Average (MA) has been consistently above the Simple Moving Average (SMA) and Exponential Moving Average (EMA), indicating a bullish trend.
- MACD: The MACD line has been consistently above the signal line, with both lines showing an upward trend, suggesting bullish momentum.
Momentum Analysis:
- RSI: The Relative Strength Index (RSI) has been in the overbought territory, indicating a strong bullish momentum.
- Stochastic Oscillator: Both %K and %D lines have been relatively high, suggesting bullish momentum.
Volatility Analysis:
- Bollinger Bands (BB): The stock price has been consistently trading above the middle Bollinger Band (BBM), indicating an upward trend with moderate volatility.
Volume Analysis:
- On-Balance Volume (OBV): The OBV has been increasing, reflecting positive buying pressure and accumulation of the stock.
- Chaikin Money Flow (CMF): The CMF has been on an upward trend, indicating strong buying pressure.
Key Observations:
- The trend indicators, momentum indicators, and volume indicators all point towards a bullish sentiment in the market.
- The volatility indicators suggest a moderate level of volatility, which is typical during bullish phases.
Conclusion:
Based on the analysis of the technical indicators, it is highly likely that WEAT will experience further upward movement in the coming days. The bullish trend, strong momentum, increasing buying pressure, and moderate volatility all support a positive outlook for the stock. Investors may consider buying or holding positions in WEAT to capitalize on the expected price appreciation.
Key Conclusion:
Bullish View: The technical analysis indicates a strong bullish sentiment for WEAT, suggesting a favorable outlook for potential price appreciation. Investors are advised to consider long positions or holding existing positions to benefit from the expected upward movement in the stock price.