Technical Analysis of WEBL 2024-05-10
Overview:
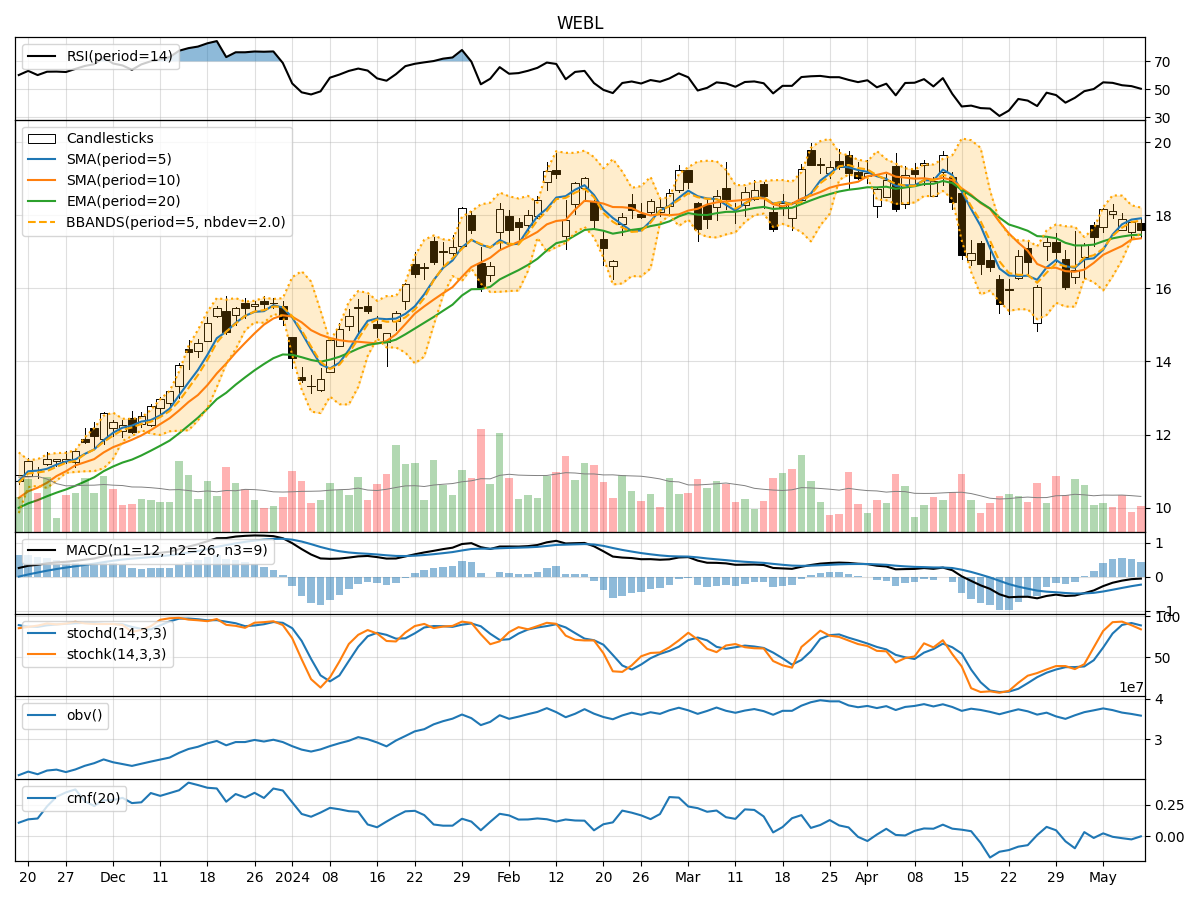
In the last 5 trading days, WEBL stock has shown a mixed performance based on various technical indicators. The trend indicators suggest a slight bearish sentiment, with the Moving Average Convergence Divergence (MACD) showing negative values. Momentum indicators also indicate a weakening trend, with Relative Strength Index (RSI) and Stochastic Oscillator pointing towards potential downward movement. Volatility indicators show a narrowing Bollinger Bands, indicating decreasing price volatility. Volume indicators suggest a decrease in On-Balance Volume (OBV) and Chaikin Money Flow (CMF), signaling potential selling pressure.
Trend Indicators:
- Moving Averages (MA) show a slight uptrend, but the MACD and MACD Histogram are negative, indicating a bearish momentum.
- Exponential Moving Average (EMA) is relatively flat, suggesting a lack of strong trend direction.
- Overall, the trend indicators point towards a bearish sentiment in the short term.
Momentum Indicators:
- RSI is hovering around the neutral zone, indicating a lack of strong buying or selling pressure.
- Stochastic Oscillator shows a downward trend, suggesting potential oversold conditions.
- Williams %R (Willams %R) is in the oversold territory, indicating a possible reversal.
- Momentum indicators collectively suggest a bearish momentum in the near future.
Volatility Indicators:
- Bollinger Bands are narrowing, indicating decreasing price volatility and a potential upcoming breakout.
- The narrowing bands suggest a period of consolidation or a potential price reversal.
- Volatility indicators imply a sideways movement or a period of consolidation in the short term.
Volume Indicators:
- On-Balance Volume (OBV) has been decreasing, indicating selling pressure and potential distribution.
- Chaikin Money Flow (CMF) is negative, suggesting a lack of buying interest.
- Volume indicators signal a bearish sentiment due to decreasing buying interest and increasing selling pressure.
Conclusion:
Based on the analysis of trend, momentum, volatility, and volume indicators, the next few days for WEBL stock are likely to see a bearish movement. The overall technical outlook suggests a potential downward trend or consolidation phase in the short term. Traders and investors should exercise caution and consider risk management strategies in light of the bearish signals across multiple technical indicators.