Technical Analysis of WEBS 2024-05-10
Overview:
In analyzing the technical indicators for WEBS stock over the last 5 days, we will delve into the trend, momentum, volatility, and volume indicators to provide a comprehensive outlook on the possible stock price movement in the coming days. By examining these key indicators, we aim to offer valuable insights and predictions for potential investors.
Trend Analysis:
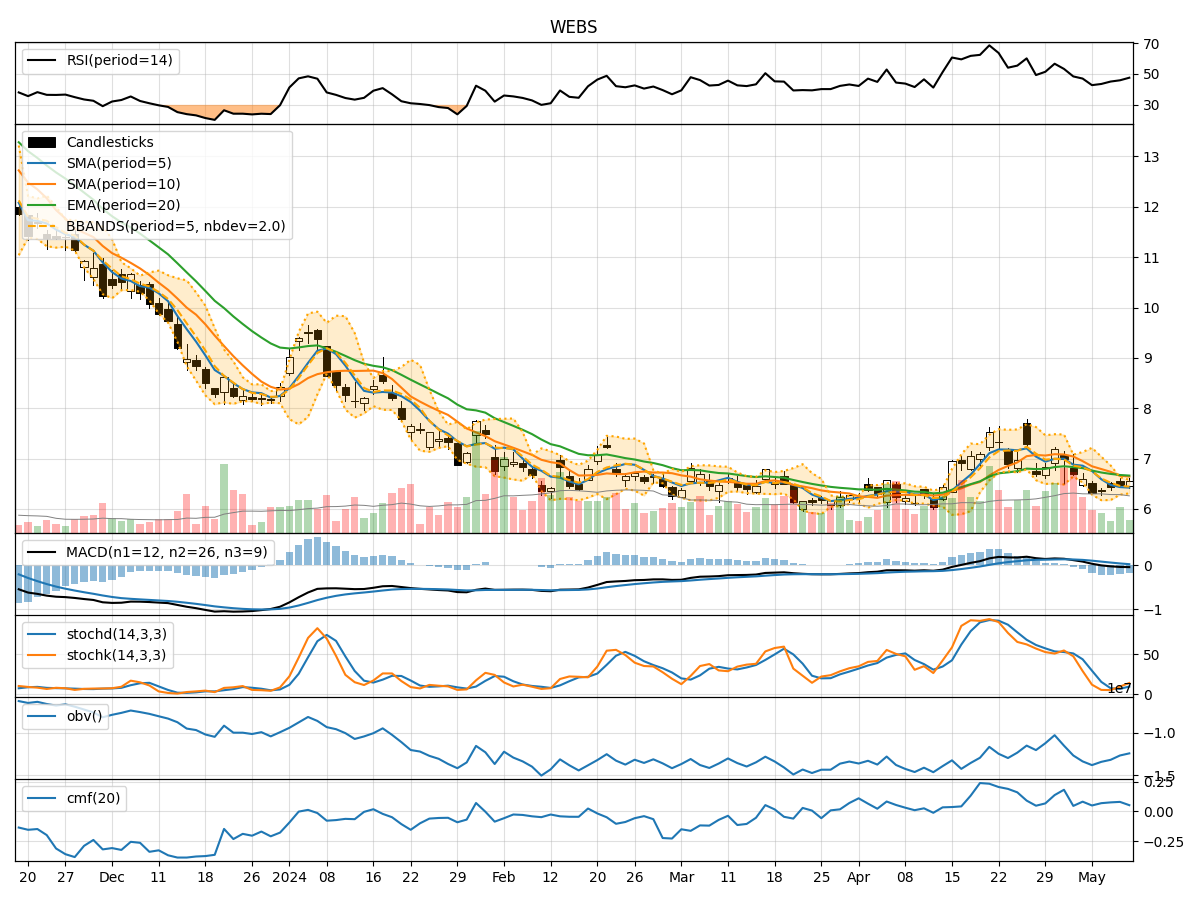
- Moving Averages (MA): The 5-day Moving Average (MA) is below the Simple Moving Average (SMA) and Exponential Moving Average (EMA), indicating a downward trend.
- MACD: The MACD line is below the signal line, suggesting a bearish trend.
- MACD Histogram: The MACD Histogram is negative, further supporting the bearish sentiment.
Key Observation: The trend indicators point towards a downward trend in the stock price.
Momentum Analysis:
- RSI: The Relative Strength Index (RSI) is below 50, indicating bearish momentum.
- Stochastic Oscillator: Both %K and %D are below 20, signaling oversold conditions.
- Williams %R: The Williams %R is below -80, suggesting the stock is oversold.
Key Observation: Momentum indicators reflect a bearish sentiment in the stock.
Volatility Analysis:
- Bollinger Bands (BB): The stock price is trading below the lower Bollinger Band, indicating oversold conditions.
- Bollinger Band Width: The Band Width is expanding, suggesting increased volatility.
- Bollinger Band %B: %B is below 0.2, indicating the stock is oversold.
Key Observation: Volatility indicators suggest the stock is oversold and experiencing increased volatility.
Volume Analysis:
- On-Balance Volume (OBV): OBV is increasing, indicating buying pressure.
- Chaikin Money Flow (CMF): CMF is positive, suggesting money flow into the stock.
Key Observation: Volume indicators show buying pressure and positive money flow into the stock.
Conclusion:
Based on the analysis of trend, momentum, volatility, and volume indicators, the overall outlook for WEBS stock in the next few days is bearish. The trend indicators, momentum oscillators, and volatility metrics all point towards a continued downward movement in the stock price. However, the positive volume indicators suggest potential buying opportunities amidst the bearish sentiment.
Key Conclusion: The stock is likely to experience further downward movement in the coming days, but investors should monitor for potential buying opportunities based on the positive volume indicators.