Technical Analysis of WEED 2024-05-10
Overview:
In analyzing the technical indicators for WEED stock over the last 5 days, we will delve into the trend, momentum, volatility, and volume indicators to provide a comprehensive outlook on the possible stock price movement in the coming days.
Trend Analysis:
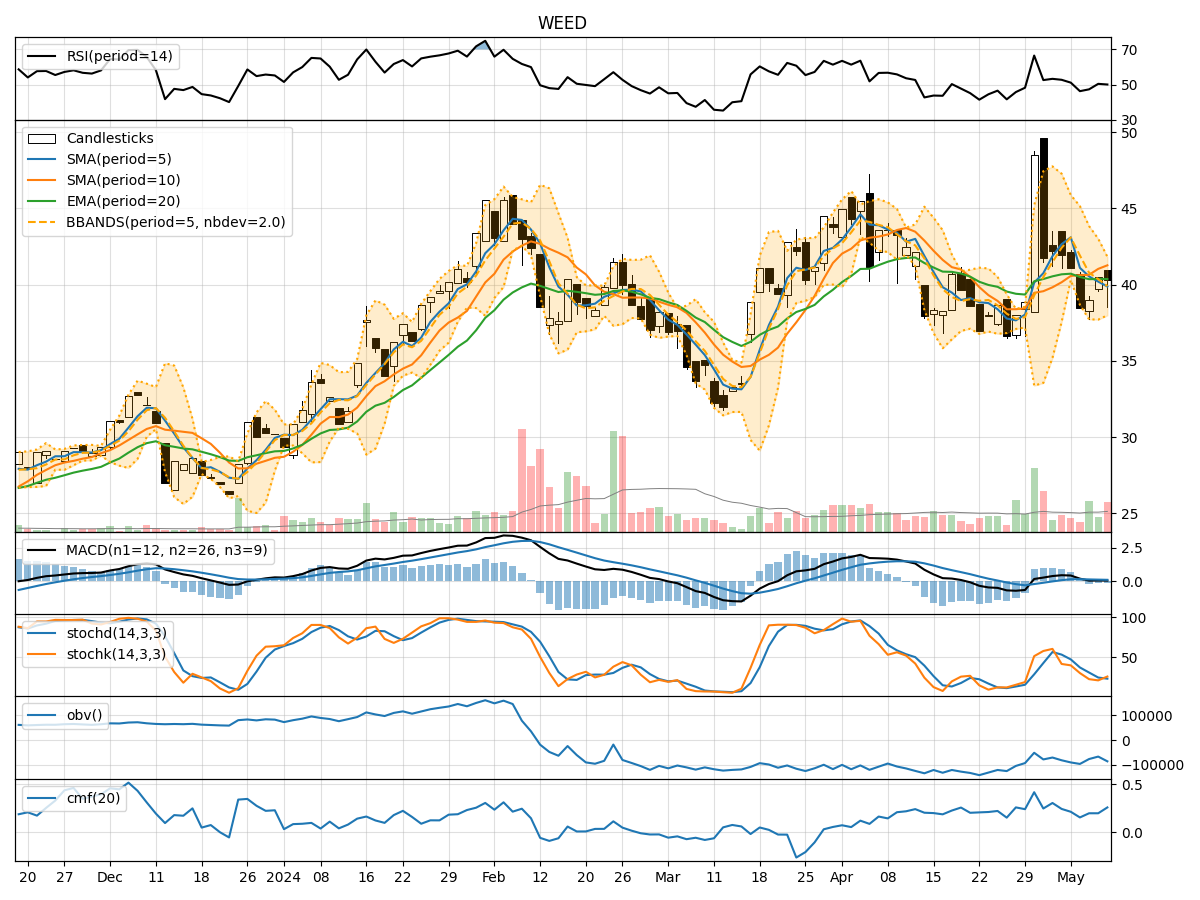
- Moving Averages (MA): The 5-day Moving Average (MA) has been consistently below the closing prices, indicating a short-term downtrend.
- MACD: The MACD line has been hovering around the signal line, suggesting a lack of strong momentum in either direction.
- RSI: The Relative Strength Index (RSI) has been fluctuating around the 50 level, indicating a balanced market sentiment.
Momentum Analysis:
- Stochastic Oscillator: The Stochastic Oscillator has been in the oversold region, hinting at a potential reversal in the near future.
- Williams %R: The Williams %R indicator has been in the oversold territory, signaling a possible buying opportunity.
Volatility Analysis:
- Bollinger Bands (BB): The Bollinger Bands have been narrowing, indicating decreasing volatility and a potential breakout in the future.
- BB %B: The %B indicator has been below 0.2, suggesting a possible oversold condition.
Volume Analysis:
- On-Balance Volume (OBV): The OBV has been declining, indicating selling pressure in the stock.
- Chaikin Money Flow (CMF): The CMF has been positive, suggesting that money is flowing into the stock despite the selling pressure.
Key Observations:
- The stock is currently in a short-term downtrend based on the moving averages.
- Momentum indicators suggest a potential reversal in the near future.
- Volatility is decreasing, indicating a period of consolidation.
- Volume indicators show selling pressure but with positive money flow into the stock.
Conclusion:
Based on the analysis of the technical indicators, the stock is likely to experience a period of consolidation in the coming days. The momentum indicators suggest a potential reversal, while decreasing volatility may lead to a breakout in either direction. The positive money flow indicated by the CMF despite selling pressure could support the stock price. Investors should closely monitor the Stochastic Oscillator and %R for potential buying opportunities.