Technical Analysis of WFHY 2024-05-10
Overview:
In analyzing the technical indicators for WFHY over the last 5 days, we will delve into the trend, momentum, volatility, and volume indicators to provide a comprehensive outlook on the possible stock price movement. By examining these key aspects, we aim to offer valuable insights and predictions for the upcoming days.
Trend Analysis:
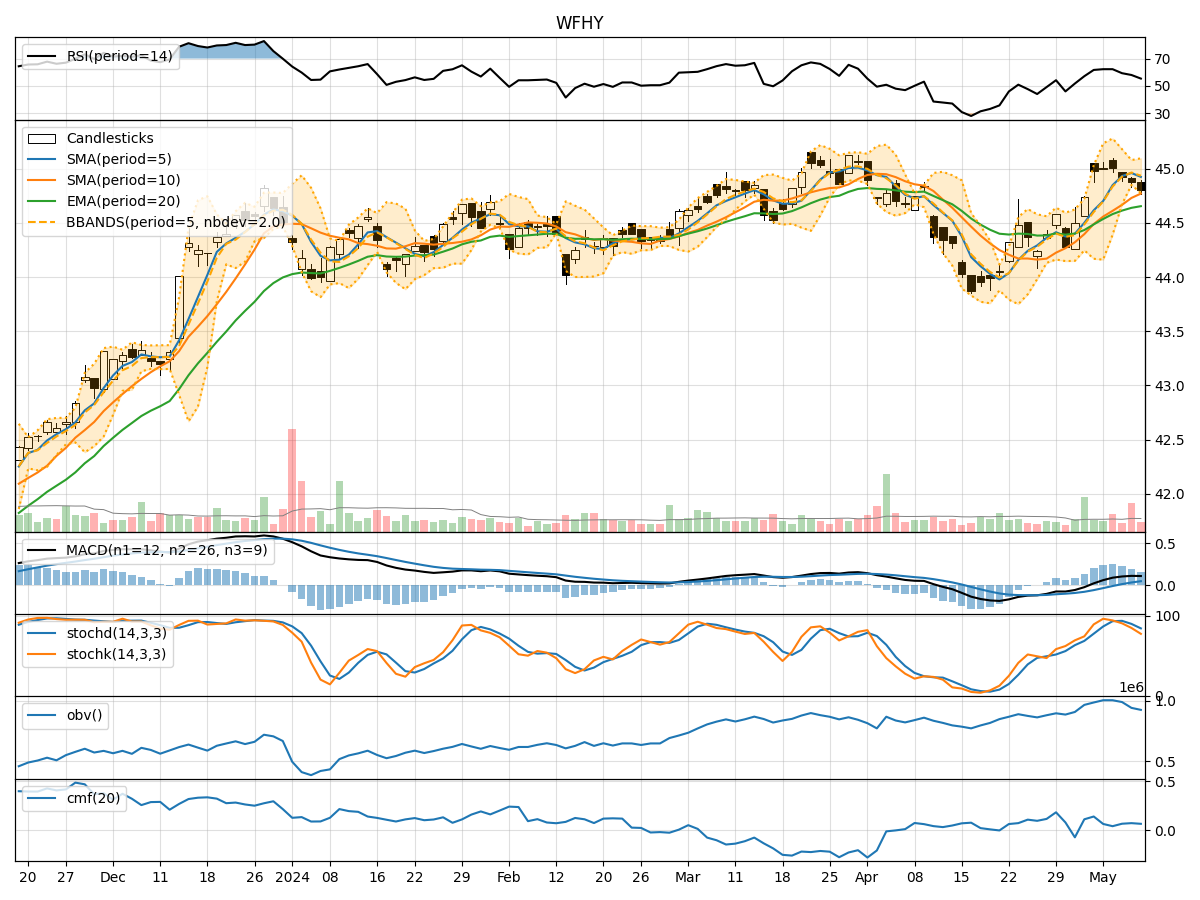
- Moving Averages (MA): The 5-day Moving Average (MA) has been consistently above the Simple Moving Average (SMA) and Exponential Moving Average (EMA), indicating a short-term bullish trend.
- MACD: The MACD line has been above the signal line, with both showing an upward trend, suggesting bullish momentum.
- RSI: The Relative Strength Index (RSI) has been fluctuating around the 60-70 range, indicating a neutral to slightly bullish sentiment.
Momentum Analysis:
- Stochastic Oscillator: The Stochastic Oscillator has been gradually decreasing, moving from overbought to oversold territory, signaling a potential reversal in momentum.
- Williams %R: The Williams %R indicator has been consistently in oversold territory, suggesting a bearish sentiment.
Volatility Analysis:
- Bollinger Bands: The Bollinger Bands have been narrowing, indicating decreasing volatility and a possible period of consolidation.
- Volatility Indicators: The Bollinger Band Percentage (BBP) has been decreasing, further supporting the view of reduced volatility.
Volume Analysis:
- On-Balance Volume (OBV): The OBV has been showing a slight decrease, indicating a potential distribution phase.
- Chaikin Money Flow (CMF): The CMF has been relatively stable, suggesting a neutral sentiment towards the stock.
Key Observations:
- The trend indicators suggest a short-term bullish outlook, supported by the MACD and moving averages.
- Momentum indicators show conflicting signals, with the Stochastic Oscillator indicating a potential reversal while the Williams %R remains bearish.
- Volatility indicators point towards a period of consolidation and reduced volatility.
- Volume indicators indicate a slight decrease in buying pressure, potentially leading to a consolidation phase.
Conclusion:
Based on the analysis of the technical indicators, the next few days for WFHY are likely to see sideways movement with a slight bias towards consolidation. The conflicting signals from momentum indicators may lead to choppy price action, while the trend indicators suggest a continuation of the short-term bullish trend. Traders should exercise caution and closely monitor key support and resistance levels for potential trading opportunities.