Technical Analysis of WFIG 2024-05-10
Overview:
In analyzing the technical indicators for WFIG over the last 5 days, we will delve into the trend, momentum, volatility, and volume indicators to provide a comprehensive outlook on the possible stock price movement in the coming days. By examining these key aspects, we aim to offer valuable insights and predictions to guide your investment decisions.
Trend Analysis:
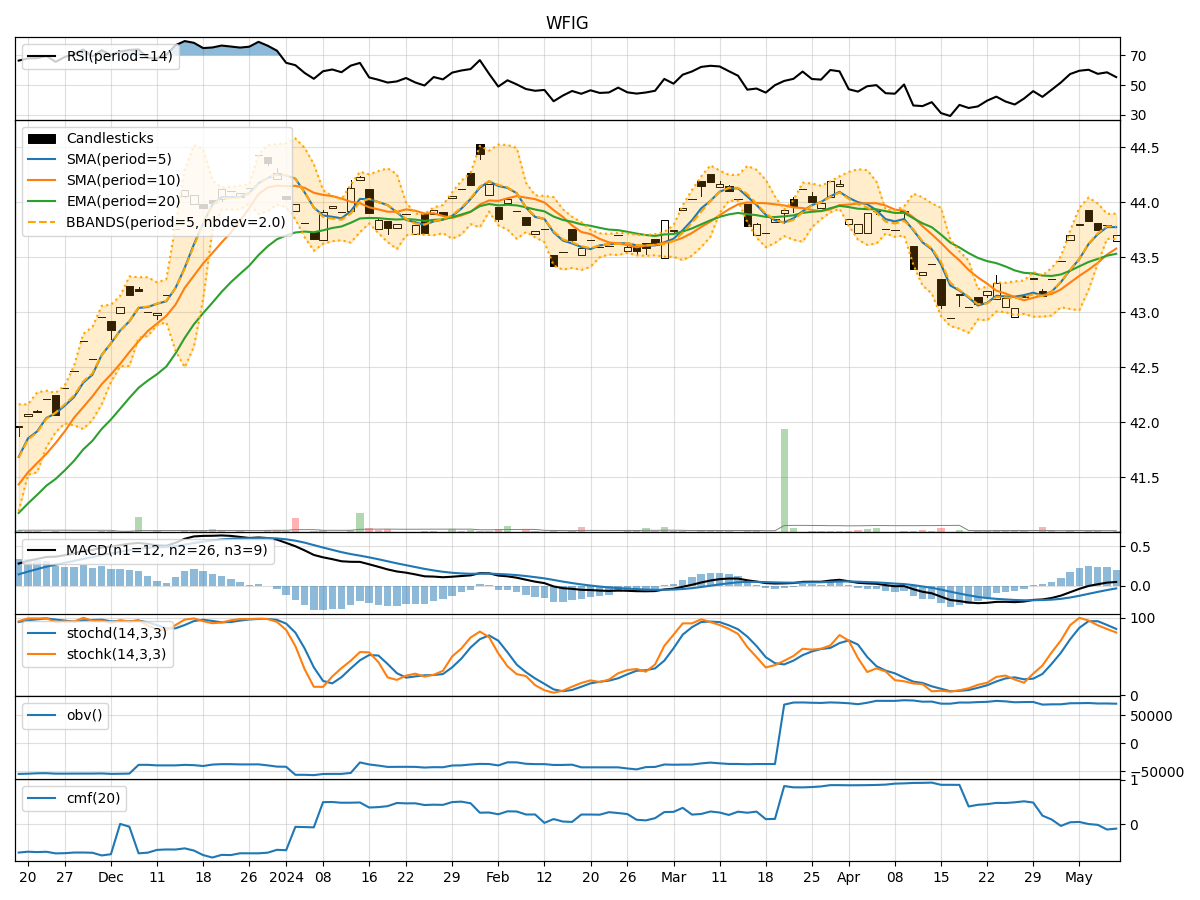
- Moving Averages (MA): The 5-day MA has been consistently above the closing prices, indicating a short-term uptrend.
- MACD: The MACD line has been positive and increasing, suggesting bullish momentum.
- RSI: The RSI has been fluctuating around the 50 level, indicating a neutral stance.
Key Observation: The trend indicators point towards a bullish sentiment in the short term.
Momentum Analysis:
- Stochastic Oscillator: Both %K and %D have been declining, signaling a potential reversal in momentum.
- Williams %R: The indicator has been in oversold territory, suggesting a possible upcoming bounce.
Key Observation: Momentum indicators are showing signs of weakness and a potential reversal.
Volatility Analysis:
- Bollinger Bands (BB): The bands have been narrowing, indicating decreasing volatility.
- BB %B: The %B indicator is hovering around the midpoint, reflecting a balanced market sentiment.
Key Observation: Volatility is decreasing, suggesting a consolidation phase in the stock.
Volume Analysis:
- On-Balance Volume (OBV): The OBV has been relatively stable, indicating no significant divergence.
- Chaikin Money Flow (CMF): The CMF has been negative, suggesting selling pressure.
Key Observation: Volume indicators imply a neutral to bearish outlook in terms of market participation.
Conclusion:
Based on the analysis of the technical indicators, the next few days' possible stock price movement for WFIG is likely to experience a sideways consolidation phase with a slight bearish bias. While the trend indicators suggest a bullish sentiment in the short term, the weakening momentum and negative volume indicators indicate a potential pullback or sideways movement. The decreasing volatility further supports the view of a consolidation phase. Traders may consider monitoring key support and resistance levels for potential entry or exit points.
Recommendation:
- Short-term Traders: Consider taking profits or tightening stop-loss levels due to the weakening momentum.
- Long-term Investors: Monitor the price action for potential accumulation opportunities during the consolidation phase.
- Risk Management: Implement proper risk management strategies to protect capital in case of unexpected price movements.
By combining insights from trend, momentum, volatility, and volume indicators, investors can make informed decisions aligned with the current market dynamics. Remember to stay updated on market developments and adjust your strategy accordingly.