Technical Analysis of WIP 2024-05-10
Overview:
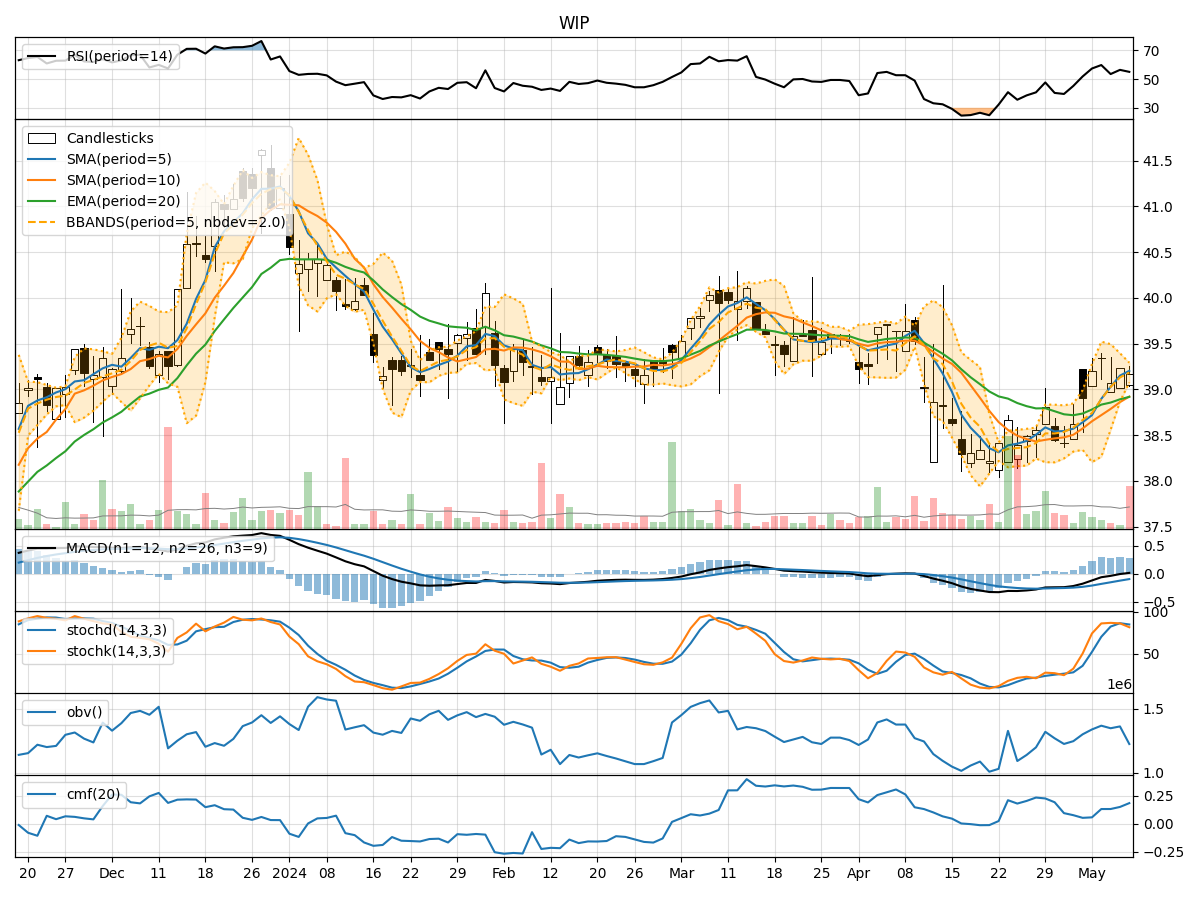
In analyzing the technical indicators for WIP stock over the last 5 days, we will delve into the trend, momentum, volatility, and volume indicators to provide a comprehensive outlook on the possible stock price movement in the coming days. By examining these key indicators, we aim to offer valuable insights and predictions for potential investors.
Trend Analysis:
- Moving Averages (MA): The 5-day Moving Average (MA) has been consistently above the Simple Moving Average (SMA) and Exponential Moving Average (EMA), indicating a bullish trend.
- MACD: The MACD line has been consistently above the signal line, suggesting a bullish momentum in the stock price.
- Conclusion: The trend indicators point towards an upward movement in the stock price.
Momentum Analysis:
- RSI: The Relative Strength Index (RSI) has been fluctuating around the 50 level, indicating a neutral momentum in the stock.
- Stochastic Oscillator: Both %K and %D have been in the overbought zone, suggesting a potential reversal in the stock price.
- Conclusion: The momentum indicators suggest a sideways movement or a possible reversal in the stock price.
Volatility Analysis:
- Bollinger Bands (BB): The stock price has been trading within the Bollinger Bands, with the bands narrowing over the last few days, indicating decreasing volatility.
- Conclusion: The volatility indicators signal a consolidation phase in the stock price.
Volume Analysis:
- On-Balance Volume (OBV): The OBV has shown mixed signals, with a slight decrease in volume over the last trading day.
- Chaikin Money Flow (CMF): The CMF has been positive, indicating buying pressure in the stock.
- Conclusion: The volume indicators suggest a neutral stance in the stock price movement.
Overall Conclusion:
Based on the analysis of the trend, momentum, volatility, and volume indicators, the upward trend in the stock price is likely to continue in the short term. However, the momentum indicators hint at a possible sideways movement or a reversal in the near future. The volatility indicators point towards a consolidation phase, while the volume indicators indicate a neutral stance.
Recommendation:
Considering the overall analysis, investors should closely monitor the stock price for any signs of a reversal in momentum or a breakout from the consolidation phase. It is advisable to set appropriate stop-loss levels and consider taking profits if the stock price shows signs of weakness. Additionally, staying informed about any market developments or news that could impact the stock price is crucial for making well-informed investment decisions.