Technical Analysis of WISE 2024-05-10
Overview:
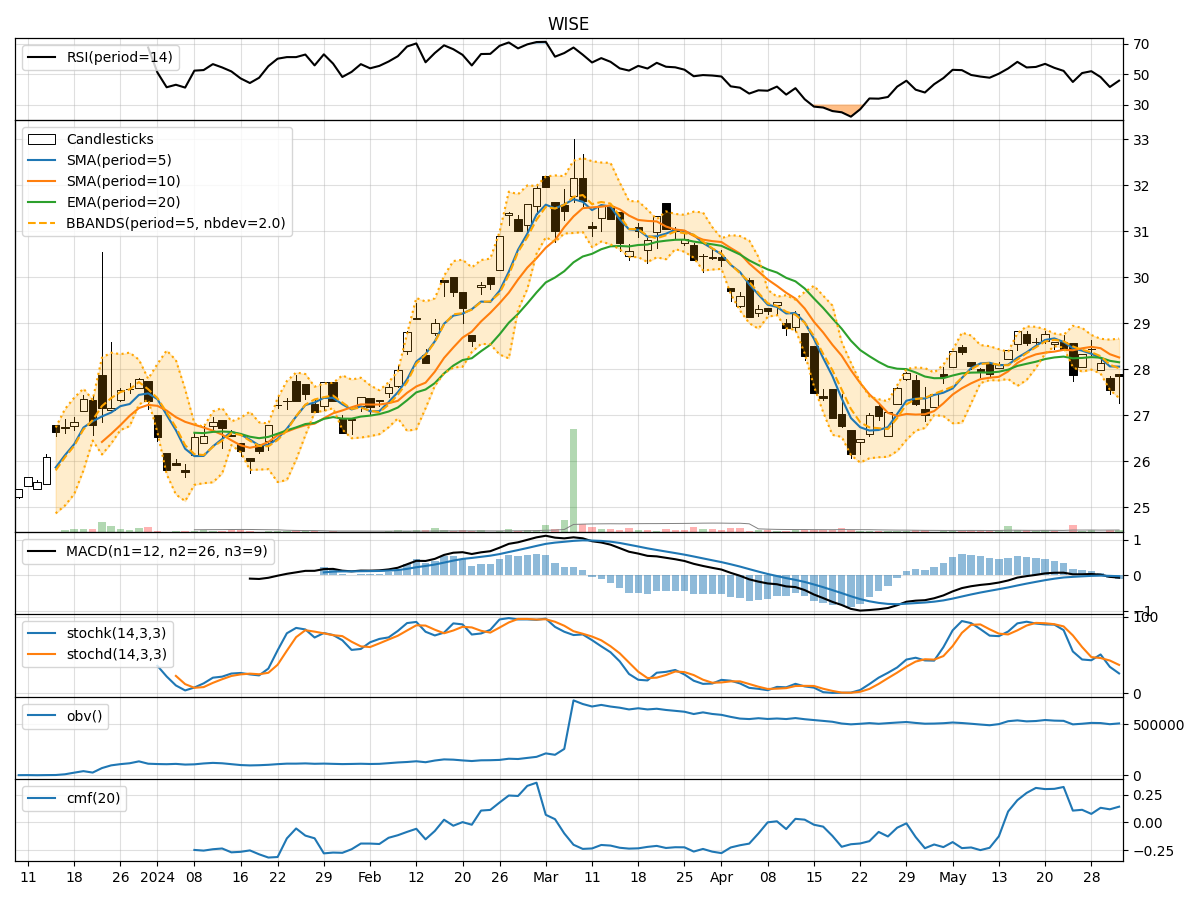
In analyzing the technical indicators for WISE stock over the last 5 days, we will delve into the trend, momentum, volatility, and volume indicators to provide a comprehensive outlook on the possible stock price movement in the coming days.
Trend Analysis:
- Moving Averages (MA): The 5-day Moving Average (MA) has been consistently above the Simple Moving Average (SMA) and Exponential Moving Average (EMA), indicating a short-term bullish trend.
- MACD: The MACD line has been negative but showing signs of convergence towards the signal line, suggesting a potential reversal in the bearish momentum.
Momentum Analysis:
- RSI: The Relative Strength Index (RSI) has been declining, indicating a weakening momentum.
- Stochastic Oscillator: Both %K and %D have been decreasing, signaling a bearish momentum.
- Williams %R: The Williams %R is in oversold territory, suggesting a possible reversal in the near term.
Volatility Analysis:
- Bollinger Bands (BB): The stock price has been trading within the Bollinger Bands, with the bands narrowing, indicating decreasing volatility.
- Bollinger %B: The %B indicator is below 1, suggesting the stock is trading below the lower band, potentially indicating an oversold condition.
Volume Analysis:
- On-Balance Volume (OBV): The OBV has been declining, indicating selling pressure in the stock.
- Chaikin Money Flow (CMF): The CMF has been negative, reflecting a lack of buying interest.
Key Observations:
- The trend indicators suggest a potential reversal in the bearish trend.
- Momentum indicators point towards a weakening momentum and a possible oversold condition.
- Volatility indicators indicate decreasing volatility, potentially leading to a consolidation phase.
- Volume indicators reflect selling pressure and a lack of buying interest in the stock.
Conclusion:
Based on the analysis of the technical indicators, the stock is likely to experience further downside movement in the coming days. The momentum is bearish, with oversold conditions indicated by the Williams %R. The decreasing volatility and negative volume indicators support a scenario of continued selling pressure. Traders should exercise caution and consider short-term bearish strategies until there are clear signs of a trend reversal.