Technical Analysis of WLDR 2024-05-10
Overview:
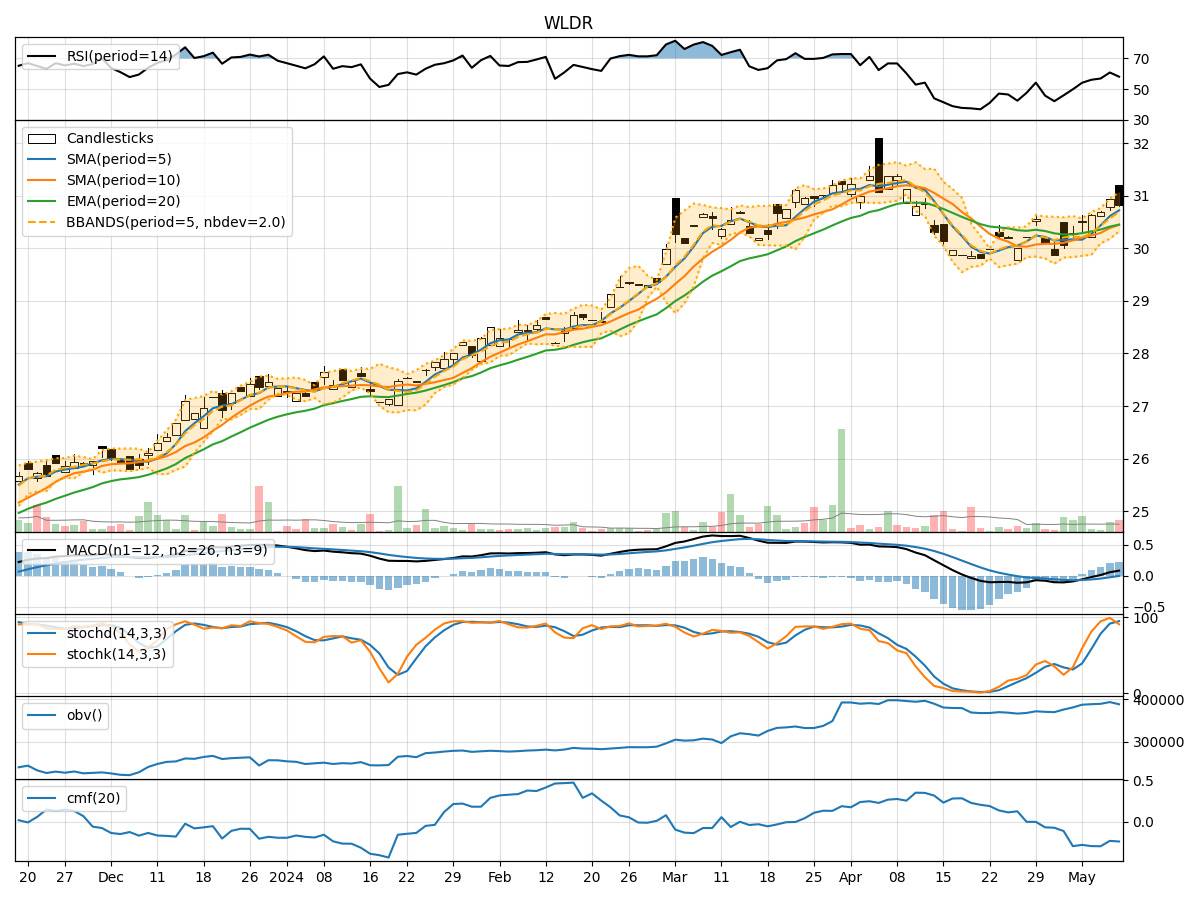
In analyzing the technical indicators for WLDR over the last 5 days, we will delve into the trend, momentum, volatility, and volume indicators to provide a comprehensive outlook on the possible stock price movement in the coming days. By examining key metrics such as moving averages, MACD, RSI, Bollinger Bands, and OBV, we aim to offer valuable insights and predictions for potential price trends.
Trend Indicators:
- Moving Averages (MA): The 5-day MA has been trending above the closing prices, indicating a short-term uptrend.
- MACD: The MACD line has been consistently above the signal line, suggesting bullish momentum.
- EMA: The EMA has been steadily increasing, reflecting a positive trend.
- Conclusion: The trend indicators point towards a bullish outlook for WLDR.
Momentum Indicators:
- RSI: The RSI has been fluctuating around the overbought territory, indicating strong buying momentum.
- Stochastic Oscillator: Both %K and %D have been in the overbought zone, signaling potential upward momentum.
- Williams %R: The indicator has been in the oversold region, suggesting a possible reversal.
- Conclusion: Momentum indicators support a bullish sentiment for WLDR.
Volatility Indicators:
- Bollinger Bands: The stock price has been trading within the bands, indicating moderate volatility.
- Conclusion: Volatility remains stable, suggesting a sideways movement in the near term.
Volume Indicators:
- On-Balance Volume (OBV): The OBV has shown a slight increase, indicating accumulation.
- Chaikin Money Flow (CMF): The CMF has been negative, signaling some selling pressure.
- Conclusion: Volume indicators suggest a mixed sentiment, with a slight bias towards accumulation.
Overall Conclusion:
Based on the analysis of trend, momentum, volatility, and volume indicators, the overall outlook for WLDR in the next few days appears to be bullish. The positive trend signals, strong momentum, and stable volatility indicate a potential for further price appreciation. However, the mixed volume indicators suggest a cautious approach, as there might be some selling pressure in the market. Traders and investors should closely monitor key support and resistance levels to capitalize on potential opportunities while managing risks effectively.