Technical Analysis of WLTG 2024-05-10
Overview:
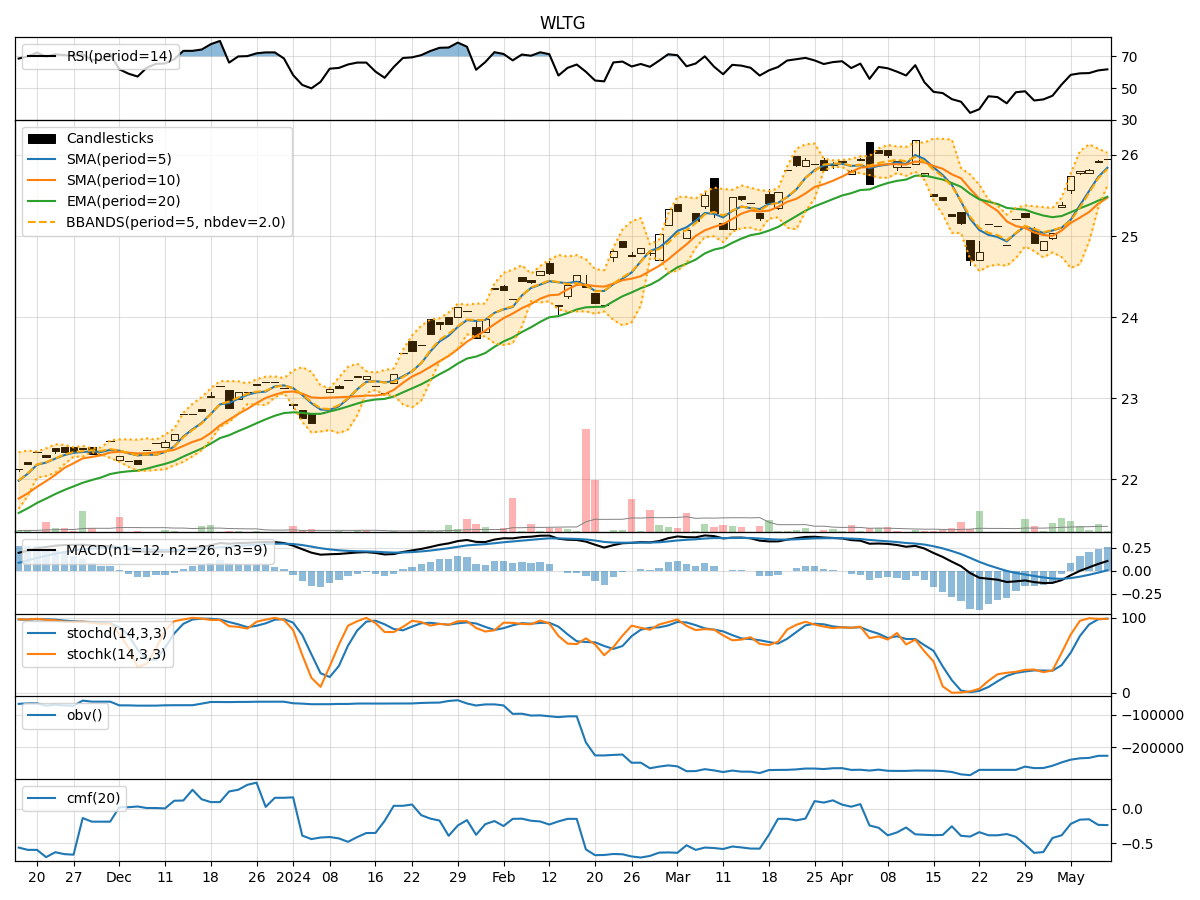
In analyzing the technical indicators for WLTG over the last 5 days, we will delve into the trend, momentum, volatility, and volume indicators to provide a comprehensive outlook on the possible stock price movement in the coming days. By examining these key indicators, we aim to offer valuable insights and predictions for potential investors.
Trend Indicators:
- Moving Averages (MA): The 5-day MA has been consistently rising, indicating a bullish trend in the short term.
- MACD: The MACD line has been above the signal line, suggesting a positive momentum in the stock price.
- EMA: The EMA has been trending upwards, supporting the bullish sentiment in the stock.
Key Observation: The trend indicators point towards a bullish outlook for WLTG in the near future.
Momentum Indicators:
- RSI: The RSI has been increasing, showing strengthening momentum in the stock.
- Stochastic Oscillator: Both %K and %D have been high, indicating potential overbought conditions.
- Williams %R: The indicator has been fluctuating around the oversold territory, suggesting a possible reversal.
Key Observation: Momentum indicators suggest a mixed sentiment with a potential for a short-term pullback.
Volatility Indicators:
- Bollinger Bands: The bands have been narrowing, indicating decreasing volatility.
- Bollinger %B: The %B has been increasing, signaling a potential uptrend.
- Average True Range (ATR): ATR has been decreasing, reflecting lower volatility in the stock.
Key Observation: Volatility indicators point towards a period of consolidation or a potential breakout.
Volume Indicators:
- On-Balance Volume (OBV): The OBV has been declining, indicating selling pressure in the stock.
- Chaikin Money Flow (CMF): CMF has been negative, suggesting outflow of money from the stock.
Key Observation: Volume indicators signal a bearish sentiment with a lack of strong buying interest.
Conclusion:
Based on the analysis of the technical indicators, the next few days for WLTG could see mixed price movements with a bullish bias in the trend indicators, a potential short-term pullback according to momentum indicators, consolidation or a breakout as per volatility indicators, and bearish sentiment in volume indicators.
Overall, the stock is likely to experience some volatility in the short term, but the bullish trend remains intact. Investors should closely monitor key support and resistance levels for potential entry or exit points.