Technical Analysis of WNDY 2024-05-10
Overview:
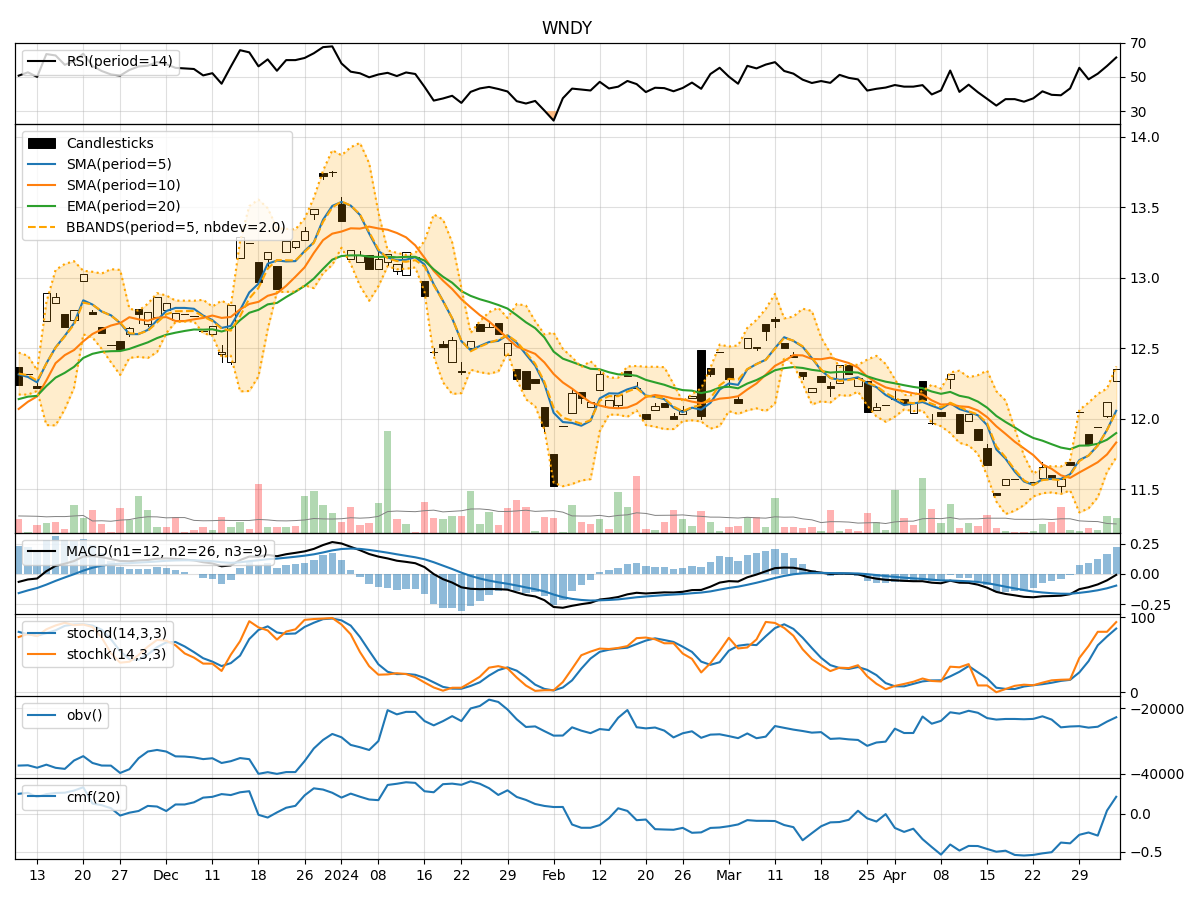
In the last 5 trading days, WNDY stock has shown a consistent uptrend in price, with increasing volumes. The moving averages have been trending upwards, indicating a bullish sentiment. Momentum indicators like RSI and Stochastic oscillators suggest the stock is in overbought territory. Volatility indicators show that the stock price has been trading within the Bollinger Bands, indicating a stable price movement. Volume indicators also show a positive accumulation/distribution trend.
Trend Analysis:
- Moving Averages (MA): The 5-day moving average has been consistently above the longer-term moving averages (SMA and EMA), indicating a strong bullish trend.
- MACD: The MACD line has been consistently above the signal line, indicating bullish momentum.
- MACD Histogram: The histogram has been increasing, indicating strengthening bullish momentum.
Momentum Analysis:
- RSI: The RSI is in the overbought zone, suggesting a potential reversal or consolidation in the near future.
- Stochastic Oscillator: Both %K and %D are in the overbought zone, indicating a possible pullback or consolidation.
- Williams %R: The Williams %R is also in the oversold territory, suggesting a potential reversal.
Volatility Analysis:
- Bollinger Bands: The stock price has been trading within the Bollinger Bands, indicating a period of stability in price movement.
- Bollinger %B: The %B indicator is hovering around 0.8, suggesting the stock is trading near the upper band.
Volume Analysis:
- On-Balance Volume (OBV): The OBV indicator has been steadily increasing, indicating strong buying pressure.
- Chaikin Money Flow (CMF): The CMF is positive, indicating that money is flowing into the stock.
Conclusion:
Based on the technical indicators and analysis: - Trend: The stock is in a strong upward trend. - Momentum: The momentum indicators suggest a potential reversal or consolidation due to overbought conditions. - Volatility: The stock is currently experiencing stability in price movement within the Bollinger Bands. - Volume: The positive OBV and CMF indicate strong buying pressure.
Forecast:
Considering the overbought conditions in the momentum indicators and the potential for a reversal, the stock may experience a short-term pullback or consolidation in the next few days. However, the overall trend remains bullish, and any pullback could present a buying opportunity for investors looking to enter or add to their positions in WNDY stock. It is essential to monitor the price action closely for any signs of a reversal or continuation of the current uptrend.