Technical Analysis of WOMN 2024-05-10
Overview:
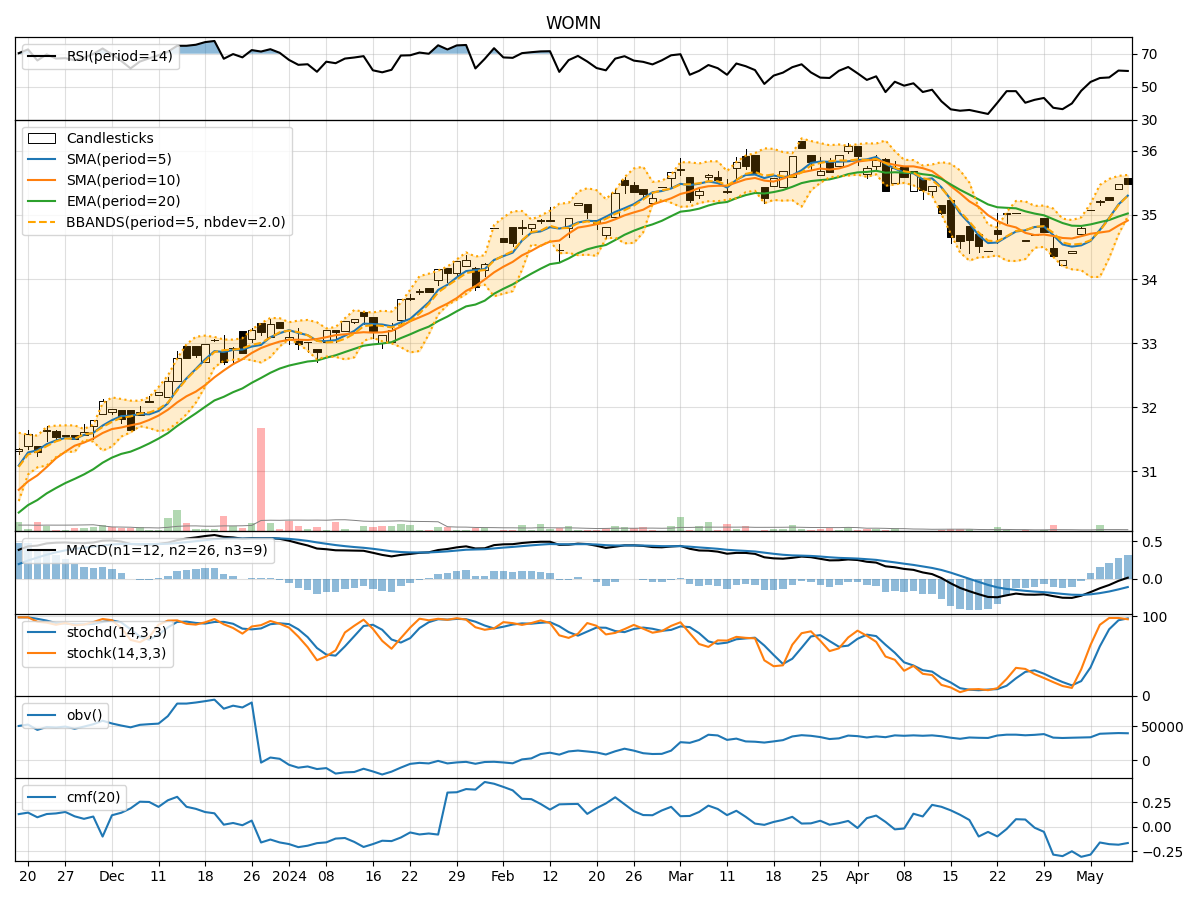
In analyzing the technical indicators for WOMN over the last 5 days, we will delve into the trend, momentum, volatility, and volume indicators to provide a comprehensive outlook on the possible stock price movement in the coming days. By examining these key indicators, we aim to offer valuable insights and predictions for informed decision-making.
Trend Analysis:
- Moving Averages (MA): The 5-day MA has been consistently above the closing prices, indicating a short-term uptrend.
- MACD: The MACD line has been positive, suggesting bullish momentum.
- EMA: The EMA has been trending upwards, supporting the bullish sentiment.
Key Observation: The trend indicators point towards a bullish outlook for WOMN.
Momentum Analysis:
- RSI: The RSI has been in the neutral to slightly overbought territory, indicating moderate buying pressure.
- Stochastic Oscillator: Both %K and %D have been in the overbought zone, signaling potential for a pullback.
- Williams %R: The indicator has been in the oversold region, suggesting a possible reversal.
Key Observation: Momentum indicators suggest a mixed sentiment with a slight bearish bias.
Volatility Analysis:
- Bollinger Bands (BB): The stock price has been within the bands, indicating moderate volatility.
Key Observation: Volatility remains stable with no extreme fluctuations.
Volume Analysis:
- On-Balance Volume (OBV): The OBV has shown a slight increase, reflecting some buying interest.
- Chaikin Money Flow (CMF): The CMF has been negative, indicating outflow of money from the stock.
Key Observation: Volume indicators suggest neutral to slightly bearish sentiment.
Conclusion:
Based on the analysis of trend, momentum, volatility, and volume indicators, the overall outlook for WOMN in the next few days is as follows: - Trend: Upward trend supported by moving averages and MACD. - Momentum: Mixed momentum with a slight bearish bias indicated by overbought conditions. - Volatility: Stable volatility within Bollinger Bands. - Volume: Neutral to slightly bearish sentiment shown by OBV and CMF.
Overall Assessment:
Considering the technical indicators and observations, the next few days for WOMN are likely to see a continuation of the bullish trend with some potential for a short-term pullback due to overbought momentum. Traders should monitor key support and resistance levels for potential entry or exit points. It is advisable to exercise caution and implement risk management strategies in trading decisions.