Technical Analysis of WRND 2024-05-10
Overview:
In analyzing the technical indicators for WRND over the last 5 days, we will delve into the trend, momentum, volatility, and volume indicators to provide a comprehensive outlook on the possible stock price movement in the coming days. By examining these key aspects, we aim to offer valuable insights and predictions to guide your investment decisions.
Trend Analysis:
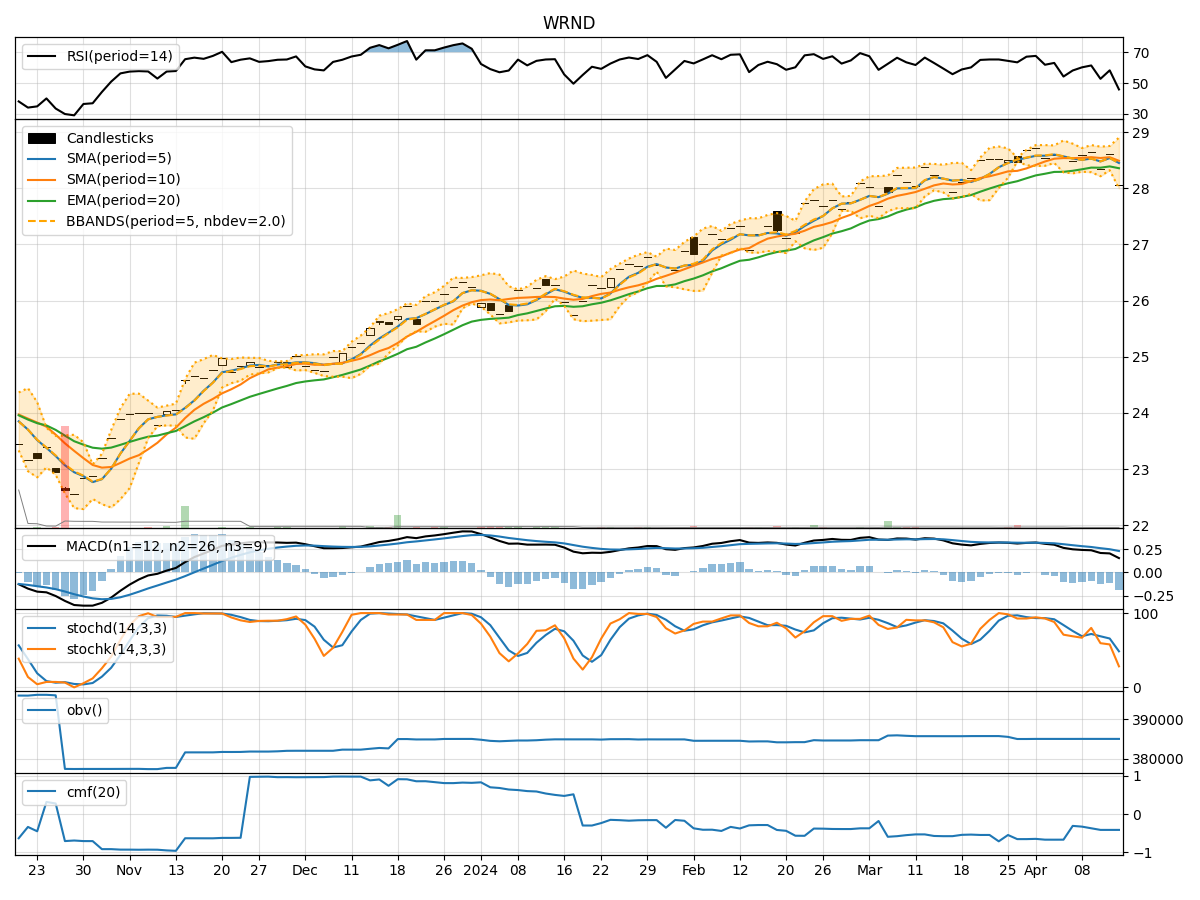
- Moving Averages (MA): The moving averages show a consistent uptrend over the last 5 days, with the closing price consistently above the short-term moving averages.
- MACD: The MACD indicator has been positive, indicating a bullish momentum in the stock.
- EMA: The exponential moving average has been trending upwards, supporting the bullish sentiment in the stock.
Key Observation: The trend indicators suggest a strong bullish trend in WRND over the last 5 days.
Momentum Analysis:
- RSI: The Relative Strength Index (RSI) has been hovering around the 60-61 range, indicating a neutral to slightly bullish momentum.
- Stochastic Oscillator: Both %K and %D have been gradually decreasing but still remain in the overbought territory.
- Williams %R: The Williams %R is showing oversold conditions, suggesting a potential reversal in momentum.
Key Observation: The momentum indicators signal a mixed sentiment with a slight bias towards a potential reversal or consolidation.
Volatility Analysis:
- Bollinger Bands: The Bollinger Bands have been narrowing, indicating decreasing volatility in the stock.
- Bollinger %B: The %B indicator shows the stock price hovering around the middle band, suggesting a period of consolidation.
- Average True Range (ATR): The ATR has been decreasing, reflecting lower volatility in the stock.
Key Observation: Volatility indicators point towards a period of consolidation or a potential decrease in price fluctuations.
Volume Analysis:
- On-Balance Volume (OBV): The OBV has been relatively flat, indicating a balance between buying and selling pressure.
- Chaikin Money Flow (CMF): The CMF has been consistently at 0, suggesting a lack of significant money flow into the stock.
Key Observation: Volume indicators reflect a lack of strong buying or selling pressure in WRND.
Conclusion:
Based on the analysis of the trend, momentum, volatility, and volume indicators, the next few days for WRND could see sideways movement or consolidation. The bullish trend indicated by the moving averages and MACD may face resistance due to the neutral to slightly bearish momentum signals and decreasing volatility. The lack of significant volume activity also supports the view of a potential period of consolidation.
In conclusion, the next few days for WRND are likely to see sideways movement with a neutral bias. It is advisable to closely monitor key support and resistance levels for potential breakout opportunities.
Remember, market conditions can change rapidly, so it's essential to stay updated with real-time data and adjust your strategy accordingly.