Technical Analysis of WTRE 2024-05-10
Overview:
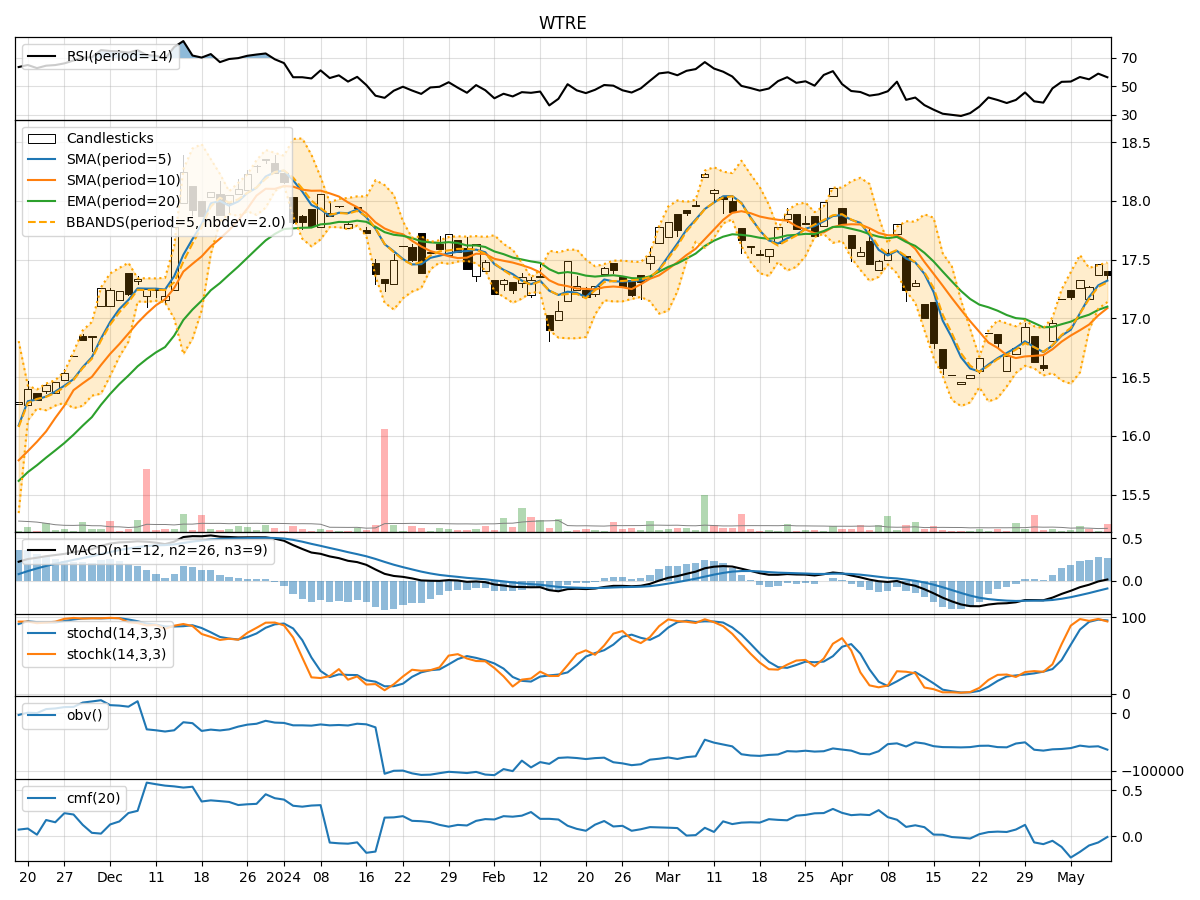
In the last 5 trading days, WTRE stock has shown mixed signals across various technical indicators. The trend indicators suggest a slightly bullish sentiment, with moving averages trending upwards. Momentum indicators show a neutral to slightly bullish stance, while volatility indicators indicate a narrowing of price range. Volume indicators are relatively weak, with no significant accumulation or distribution signals.
Trend Indicators:
- Moving Averages (MA): The 5-day MA is above both the 10-day SMA and the 20-day EMA, indicating a short-term bullish trend.
- MACD: The MACD line is above the signal line, suggesting bullish momentum.
- MACD Histogram: The histogram is positive, indicating increasing bullish momentum.
Key Observation: The trend indicators point towards a bullish sentiment in the short term.
Momentum Indicators:
- RSI: The RSI is in the neutral zone, not indicating overbought or oversold conditions.
- Stochastic Oscillator: Both %K and %D are in the overbought zone, suggesting potential for a pullback.
- Williams %R: The indicator is in the oversold territory, indicating a potential reversal.
Key Observation: Momentum indicators are mixed, with some showing overbought conditions and others suggesting a reversal.
Volatility Indicators:
- Bollinger Bands: The bands are narrowing, indicating decreasing volatility.
- Bollinger %B: The %B is below 1, suggesting the price is below the upper band.
Key Observation: Volatility is decreasing, which could lead to a period of consolidation or a breakout.
Volume Indicators:
- On-Balance Volume (OBV): The OBV is relatively flat, indicating no significant accumulation or distribution.
- Chaikin Money Flow (CMF): The CMF is negative, suggesting selling pressure.
Key Observation: Volume indicators are weak, with no clear accumulation or distribution signals.
Conclusion:
Based on the analysis of the technical indicators, the next few days for WTRE stock could see sideways movement or a potential pullback. The trend indicators suggest a bullish bias, but the mixed signals from momentum and volume indicators indicate a lack of strong conviction in the market. The decreasing volatility could lead to a period of consolidation before the next directional move.
Overall View: The stock is likely to consolidate in the near term, with a potential for a slight pullback before resuming its upward trend. It is advisable to closely monitor key support and resistance levels for potential entry or exit points.