Technical Analysis of WTV 2024-05-10
Overview:
In analyzing the technical indicators for WTV over the last 5 days, we will delve into the trend, momentum, volatility, and volume indicators to provide a comprehensive outlook on the possible stock price movement in the coming days. By examining these key aspects, we aim to offer valuable insights and predictions to guide your investment decisions.
Trend Indicators:
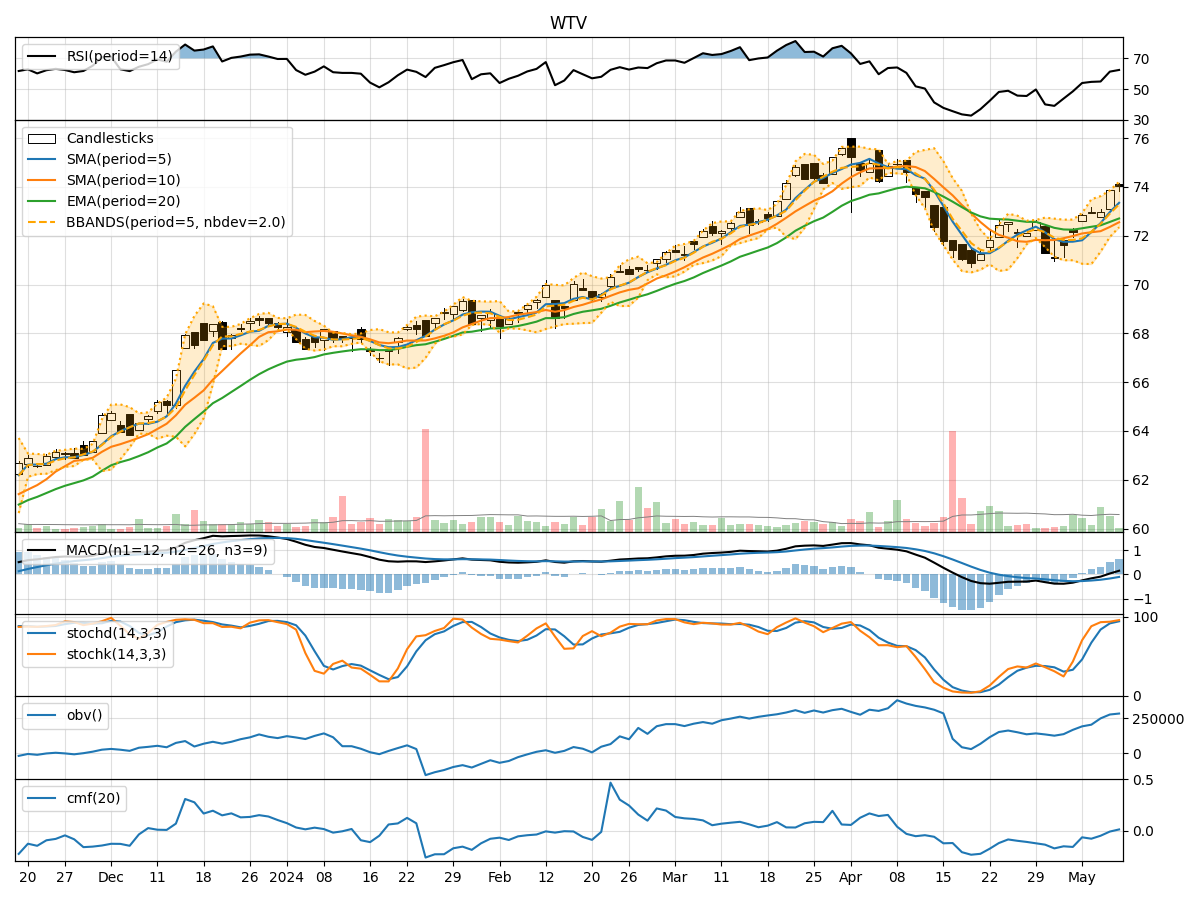
- Moving Averages (MA): The 5-day moving average has been consistently rising, indicating a positive trend in the stock price.
- MACD: The MACD line has been increasing, with the MACD histogram also showing an upward trend, suggesting bullish momentum.
- EMA: The exponential moving average has been steadily climbing, supporting the bullish outlook for the stock.
Momentum Indicators:
- RSI: The Relative Strength Index has been trending upwards, indicating increasing buying pressure and potential for further price appreciation.
- Stochastic Oscillator: Both %K and %D have been in overbought territory, suggesting a strong bullish momentum.
- Williams %R: The indicator has been hovering in the oversold region, signaling a potential reversal to the upside.
Volatility Indicators:
- Bollinger Bands: The bands have been widening, indicating increased volatility in the stock price.
- Bollinger %B: The %B indicator has been fluctuating within a range, suggesting potential price reversals.
- Bollinger Bandwidth: The bandwidth has been expanding, reflecting heightened volatility in the stock.
Volume Indicators:
- On-Balance Volume (OBV): The OBV has been trending upwards, indicating accumulation of the stock by investors.
- Chaikin Money Flow (CMF): The CMF has been negative, suggesting selling pressure in the stock.
Key Observations and Opinions:
- Trend: The stock is in a strong upward trend based on moving averages and MACD, indicating a bullish sentiment.
- Momentum: Momentum indicators like RSI and Stochastic Oscillator suggest a continuation of the bullish momentum.
- Volatility: Increasing volatility, as indicated by Bollinger Bands, could lead to sharp price movements in the near term.
- Volume: The rising OBV signals positive investor sentiment, while the negative CMF indicates some selling pressure.
Conclusion:
Based on the analysis of the technical indicators, the next few days are likely to see continued upward movement in the stock price of WTV. The bullish trend, supported by momentum indicators and increasing volume, suggests that the stock is poised for further gains. However, investors should remain cautious of the heightened volatility, which could lead to short-term price fluctuations. Overall, the outlook for WTV appears bullish in the near future.