Technical Analysis of WUCT 2024-05-10
Overview:
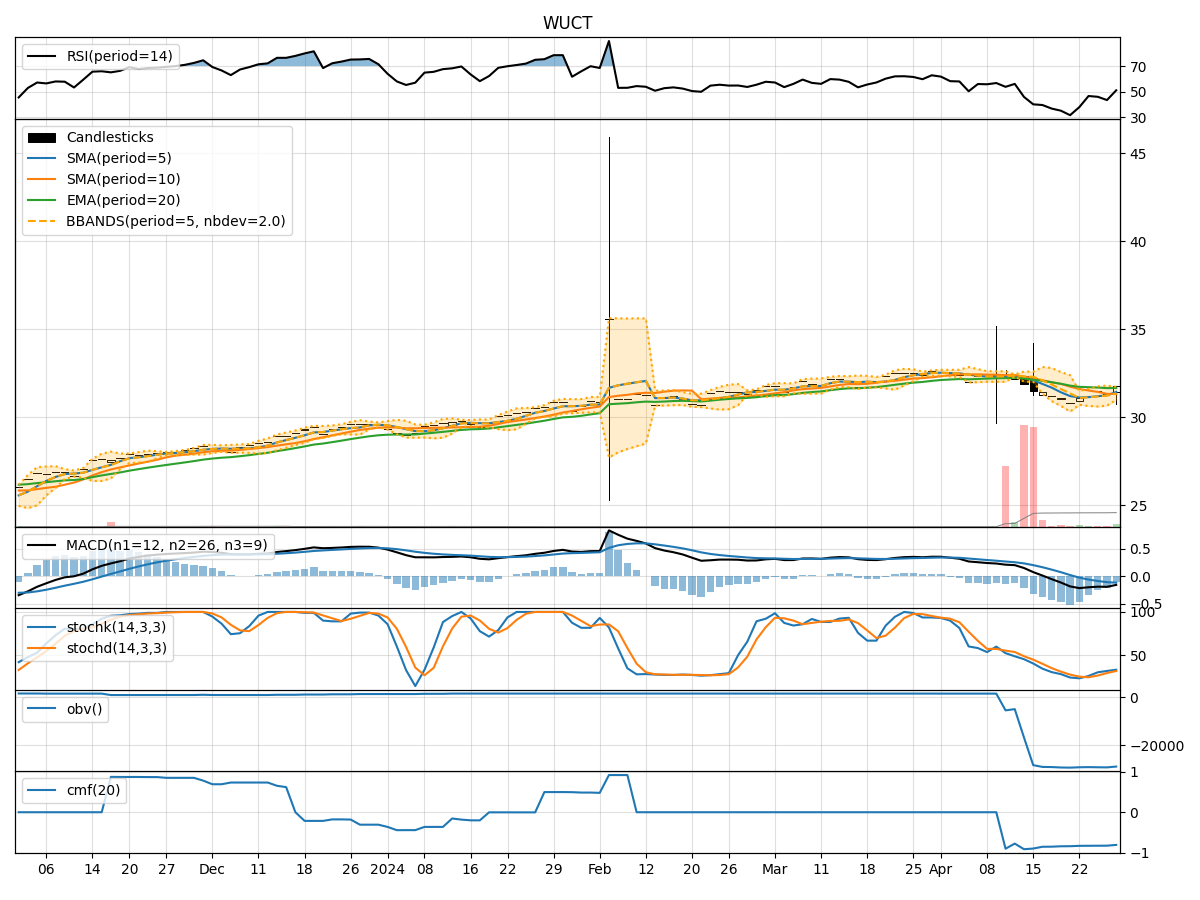
In the last 5 trading days, WUCT stock has shown a gradual increase in price, accompanied by fluctuating volume levels. The trend indicators suggest a positive momentum with moving averages and MACD showing an upward trend. Momentum indicators like RSI and Stochastic oscillators indicate a slightly overbought condition. Volatility indicators show a widening Bollinger Band, indicating increased price volatility. Volume indicators like OBV and CMF suggest a slight decrease in buying pressure.
Trend Analysis:
- Moving Averages (MA): The 5-day MA has been consistently above the closing price, indicating a bullish trend.
- MACD: The MACD line has been consistently above the signal line, indicating a bullish trend.
- EMA: The EMA has been steadily increasing, supporting the bullish momentum.
Momentum Analysis:
- RSI: The RSI is in the overbought territory, suggesting a potential reversal or consolidation.
- Stochastic Oscillators: Both %K and %D are in the overbought zone, indicating a possible pullback.
- Williams %R: The Williams %R is also in the overbought region, signaling a potential reversal.
Volatility Analysis:
- Bollinger Bands: The widening of the Bollinger Bands indicates increasing volatility in the stock price.
- Bollinger Band %B: The %B is close to 1, suggesting the stock is trading near the upper band, potentially overbought.
Volume Analysis:
- On-Balance Volume (OBV): The OBV has been slightly decreasing, indicating a divergence between price and volume.
- Chaikin Money Flow (CMF): The CMF is negative, suggesting a decrease in buying pressure.
Key Observations:
- The stock is currently in an overbought condition based on momentum indicators like RSI, Stochastic, and Williams %R.
- The volatility has increased, as indicated by the widening Bollinger Bands.
- The volume has shown a slight decrease, suggesting weakening buying pressure.
Conclusion:
Based on the technical analysis of the trend, momentum, volatility, and volume indicators, the next few days for WUCT stock are likely to see a potential pullback or consolidation. The overbought conditions indicated by momentum oscillators suggest a possible reversal in the short term. The widening Bollinger Bands and decreasing buying pressure further support this view. Traders may consider taking profits or waiting for a better entry point before considering long positions.