Technical Analysis of WUGI 2024-05-10
Overview:
In analyzing the technical indicators for WUGI over the last 5 days, we will delve into the trend, momentum, volatility, and volume indicators to provide a comprehensive outlook on the possible stock price movement in the coming days. By examining these key indicators, we aim to offer valuable insights and predictions for informed decision-making.
Trend Analysis:
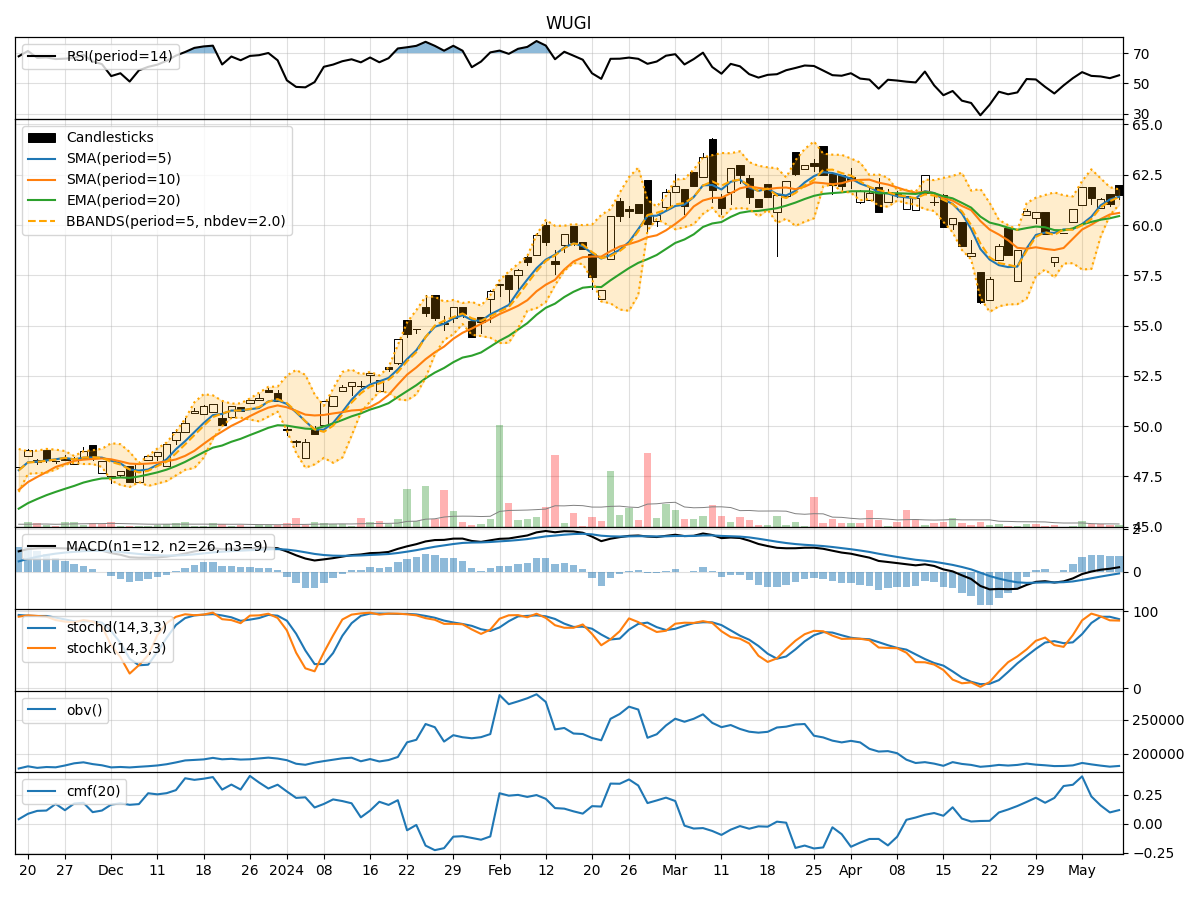
- Moving Averages (MA): The 5-day Moving Average (MA) has been consistently above the Simple Moving Average (SMA) and Exponential Moving Average (EMA), indicating a bullish trend.
- MACD: The MACD line has been consistently above the signal line, with both lines showing an upward trend, suggesting bullish momentum.
Momentum Analysis:
- RSI: The Relative Strength Index (RSI) has been fluctuating around the overbought territory, indicating strong buying pressure.
- Stochastic Oscillator: Both %K and %D have been in the overbought zone, suggesting a potential reversal or consolidation.
Volatility Analysis:
- Bollinger Bands (BB): The stock price has been trading within the upper Bollinger Band (BBU), indicating high volatility.
Volume Analysis:
- On-Balance Volume (OBV): The OBV has been declining, suggesting a divergence between price and volume.
- Chaikin Money Flow (CMF): The CMF has been positive but decreasing, indicating weakening buying pressure.
Key Observations:
- The trend indicators suggest a strong bullish sentiment in the short term.
- Momentum indicators show potential overbought conditions, signaling a need for caution.
- Volatility remains high, indicating potential price swings.
- Volume indicators point to a divergence between price and volume, raising concerns about the sustainability of the current trend.
Conclusion:
Based on the analysis of the technical indicators, the next few days for WUGI stock price movement are likely to be sideways to slightly bearish. While the trend indicators signal a bullish outlook, the overbought conditions in momentum indicators and divergence in volume indicators suggest a possible correction or consolidation in the near term. Traders should exercise caution and consider implementing risk management strategies to navigate potential price fluctuations.