Technical Analysis of WWJD 2024-05-10
Overview:
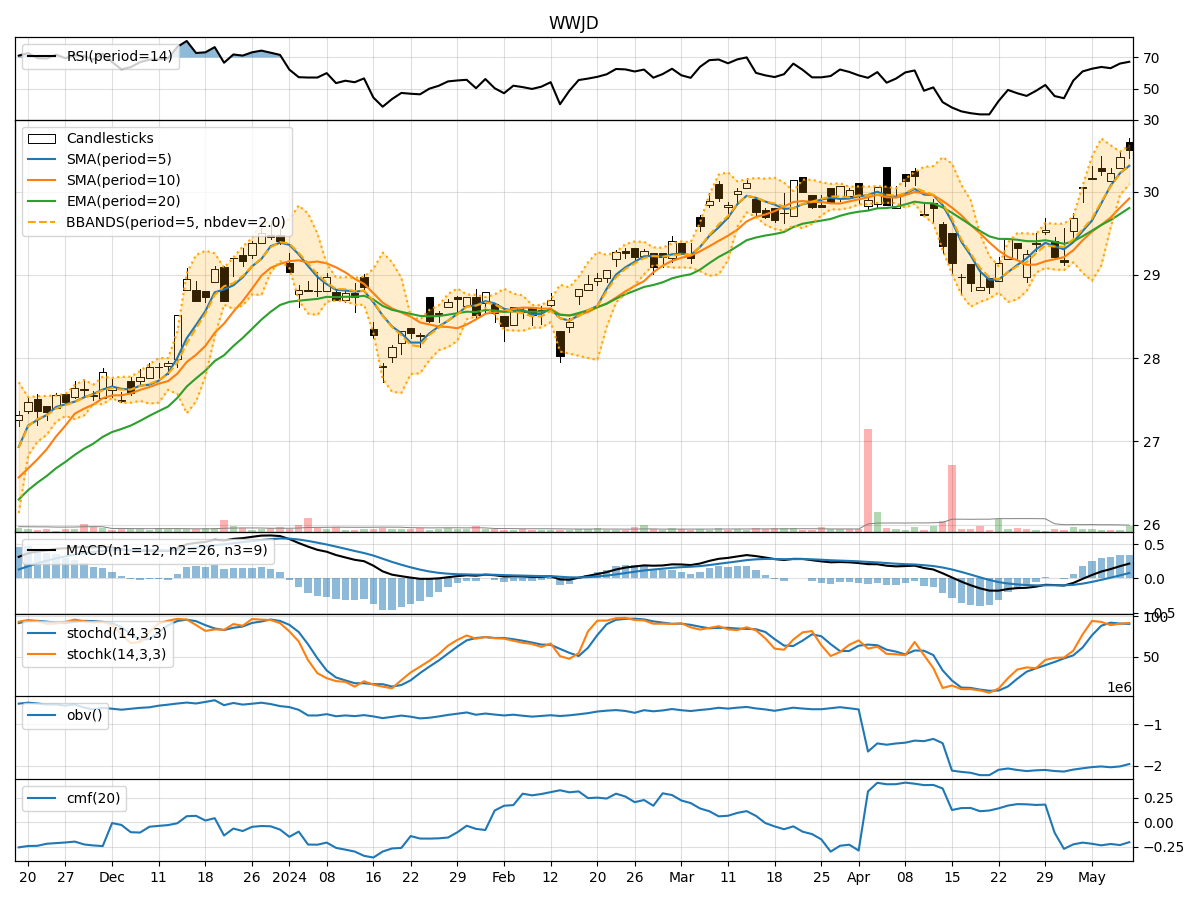
In the last 5 trading days, WWJD stock has shown a consistent uptrend in its price, supported by positive momentum and volatility indicators. The stock has also experienced increasing trading volume, indicating growing interest from market participants. However, it is essential to delve deeper into each technical indicator category to provide a comprehensive analysis and make informed predictions about the possible stock price movement in the next few days.
Trend Indicators Analysis:
- Moving Averages (MA): The 5-day Moving Average (MA) has been consistently above the Simple Moving Average (SMA) and Exponential Moving Average (EMA), indicating a bullish trend.
- MACD: The MACD line has been consistently above the signal line, with both lines showing an upward trajectory, suggesting further potential price appreciation.
- Momentum: The Relative Strength Index (RSI) has been in the overbought territory, indicating strong buying momentum.
Momentum Indicators Analysis:
- RSI: The RSI has been consistently above 50, indicating bullish momentum in the stock.
- Stochastic Oscillator: Both %K and %D lines of the Stochastic Oscillator have been in the overbought zone, suggesting a strong upward momentum.
- Williams %R: The Williams %R has been consistently in the oversold region, indicating a potential reversal in the stock price.
Volatility Indicators Analysis:
- Bollinger Bands: The stock price has been trading within the upper Bollinger Band, suggesting an overbought condition.
- Bollinger %B: The Bollinger %B has been above 0.8, indicating a high volatility period.
- Average True Range (ATR): The ATR has shown an increase in volatility over the last few days.
Volume Indicators Analysis:
- On-Balance Volume (OBV): The OBV has been declining, indicating some distribution happening in the stock.
- Chaikin Money Flow (CMF): The CMF has been negative, suggesting selling pressure in the stock.
Key Observations and Opinions:
- Trend: The stock is in a strong bullish trend based on moving averages and MACD.
- Momentum: The momentum indicators suggest a continuation of the bullish trend.
- Volatility: The stock is currently experiencing high volatility, which could lead to sharp price movements.
- Volume: The declining OBV and negative CMF indicate some caution regarding the stock's future price movement.
Conclusion:
Based on the analysis of the technical indicators, the next few days' possible stock price movement for WWJD is likely to continue in an upward direction. The bullish trend supported by positive momentum indicators and high volatility may lead to further price appreciation. However, caution is advised due to the declining OBV and negative CMF, indicating some selling pressure. Traders and investors should closely monitor the price action and volume dynamics to make informed decisions.